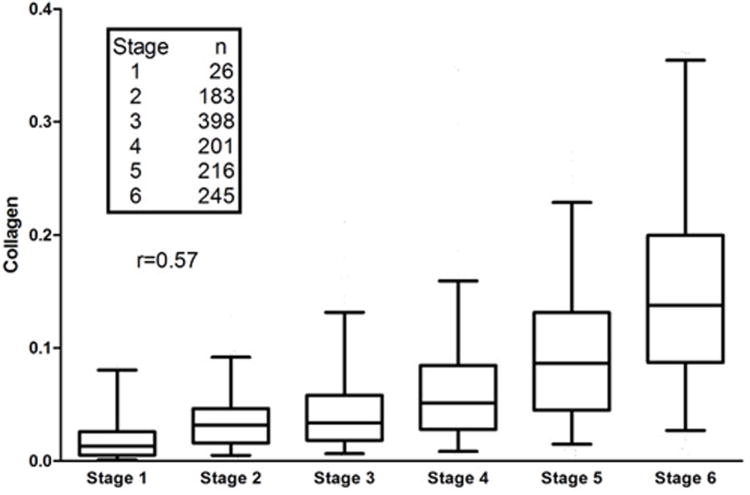
Figure 3.
Distribution of measurements of collagen content at each Ishak fibrosis stage for the 1269 liver biopsies in the study. The boxes show the median, 25th and 75th percentiles, whereas the lines 2.5 and 97.5 percentiles (outliers not shown). The Spearman correlation coefficient is 0.57 (p<0.0001).

