
FIGURE 3.
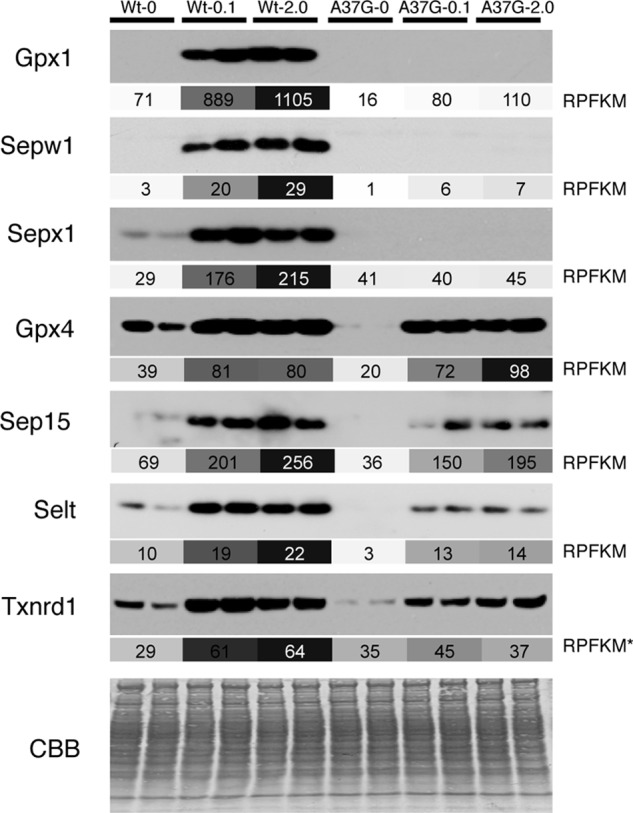
Comparison of Western blots and ribosome profiling measurements of selenoprotein synthesis. Western blots of Gpx1, Sepw1, Sepx1, Gpx4, Sep15, Selt, and Txnrd1 from two biological samples are shown above the corresponding RPFKM (ribosome footprint reads/kilobase/million mapped reads) values in shaded boxes. For each selenoprotein, RPFKM values are shaded according to a continuous scale from 0 RPFKM (white) to the highest RPFKM value for that gene (dark gray). RPFKM values are for the portion of the mRNA downstream of the UGA-Sec codon except for Txnrd1, where the RPFKM value is for the CDS (RPFKM*). CBB, Coomassie Blue staining.