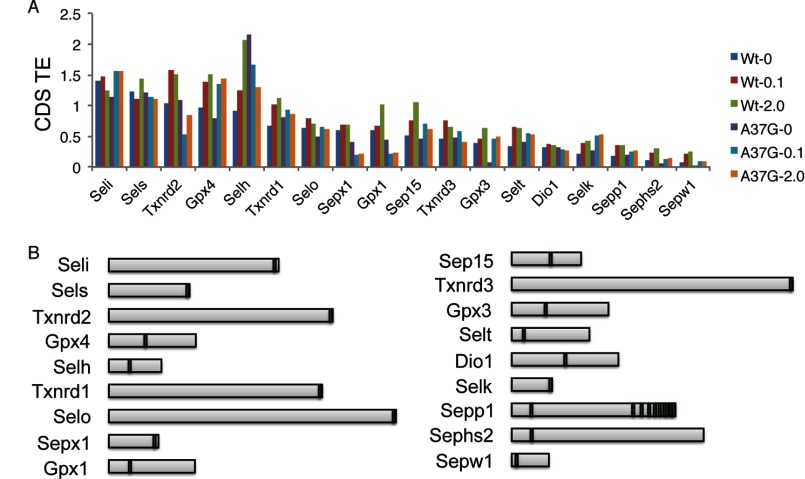
FIGURE 4.
Translational efficiency of selenoprotein coding sequences. A, translational efficiency was calculated as the ribosome footprint RPFKMs/RNA RPKMs across each CDS for WT and TrspA37G mice fed diets supplemented with 0, 0.1, or 2.0 ppm selenium diets. B, relative length and position of the UGA-Sec codon (vertical bars) are shown for each selenoprotein.

