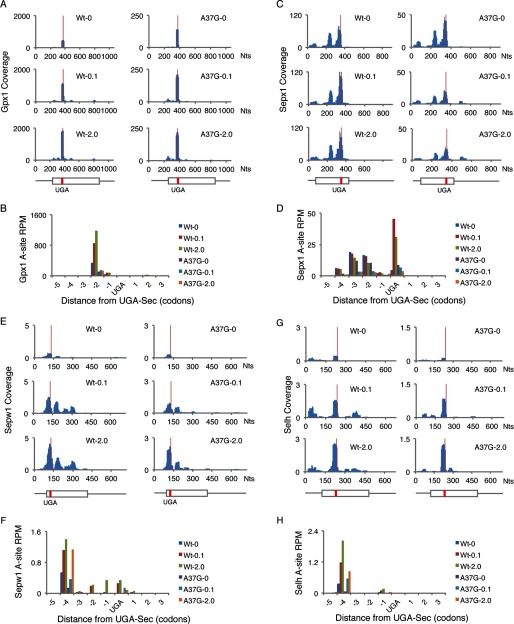
FIGURE 6.
Ribosome footprints near UGA-Sec codons. The number of ribosome footprints mapping to each nucleotide across the mRNAs of Gpx1 (A), Sepx1 (C), Sepw1 (E), and Selh (G) normalized to total mapped reads (Coverage) is shown for each mRNA in livers of WT or TrspA37G (A37G) mice fed diets supplemented with 0, 0.1, or 2.0 ppm selenium. Below the histograms in A, C, E, and G is a schematic of each mRNA. Thin lines represent UTRs, boxes represent open reading frames, and red lines indicate the position of the UGA-Sec codons. The number of ribosome footprints with A-site codons assigned to the −5 to +3 codons relative to UGA-Sec, normalize to total mapped reads (reads per million mapped reads, rpm, is shown for Gpx1 (B), Sepx1 (D), Sepw1 (F), and Selh (H).

