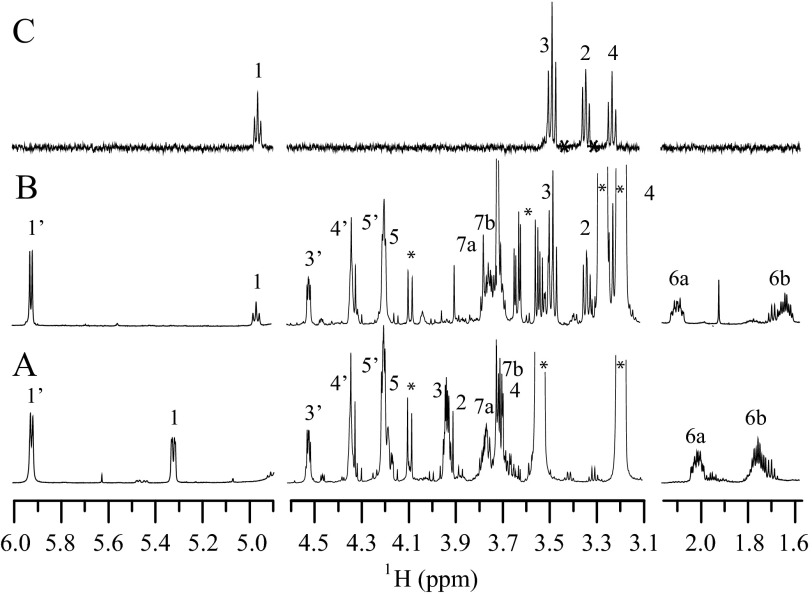
FIGURE 6.
NMR spectroscopic identification of the MlghC product P5γ. Selected regions of the 600 MHz 1H NMR spectra for GDP-6-deoxy-d-altro-heptose P5α, obtained via the activity of DdahA, DdahB and DdahC (A) and for GDP-6-deoxy-l-gluco-heptose P5γ (B), obtained by activity of DdahA, MlghB and MlghC on GDP-d-glycero-d-manno-heptose. The spectrum (C) shows regions from the selective one-dimensional total correlation spectroscopy experiment obtained from excitation of H1 at 4.97 ppm. The spectrum shows that protons H1, H2, H3, and H4 all have large coupling constants to neighboring protons. Each spectrum shows the 1H assignments for the pyranose (1–7) and ribose (1′-5′) portions of the molecules. Peaks labeled (*) arise from buffer impurities.

