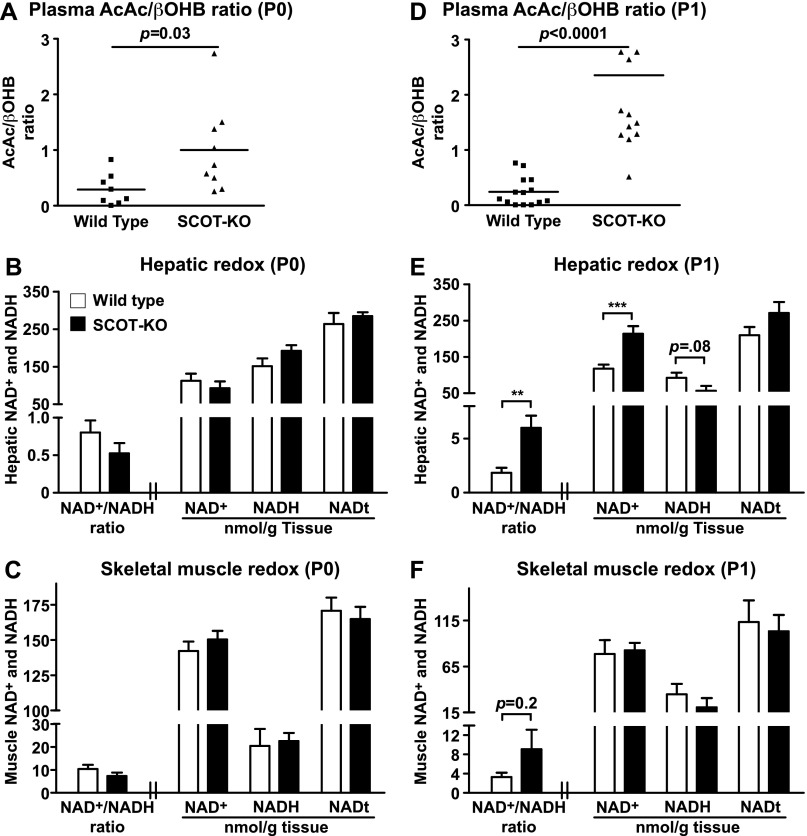
FIGURE 6.
Oxidized hepatic redox potential in P1 SCOT-KO mice. A, plasma AcAc/d-βOHB molar ratios in milk-fed P0 mice. n = 8–9/group. B and C, NAD+/NADH ratios, NAD+, NADH, and total NAD (NAD+ + NADH; NADt (nmol/g of tissue)) in livers (n = 5/group) (B) and skeletal muscles (C) of fed P0 neonates (n = 6/group). D, plasma AcAc/d-βOHB molar ratios in P1 mice. n = 11–14/group. E and F, NAD+/NADH ratios, [NAD+], [NADH], and [NADt] (nmol/g of tissue) in livers (E) and skeletal muscles (F) of P1 wild-type and SCOT-KO mice. n = 13–14/group. **, p < 0.01; ***, p < 0.001 by Student's t test. Error bars, S.E.

