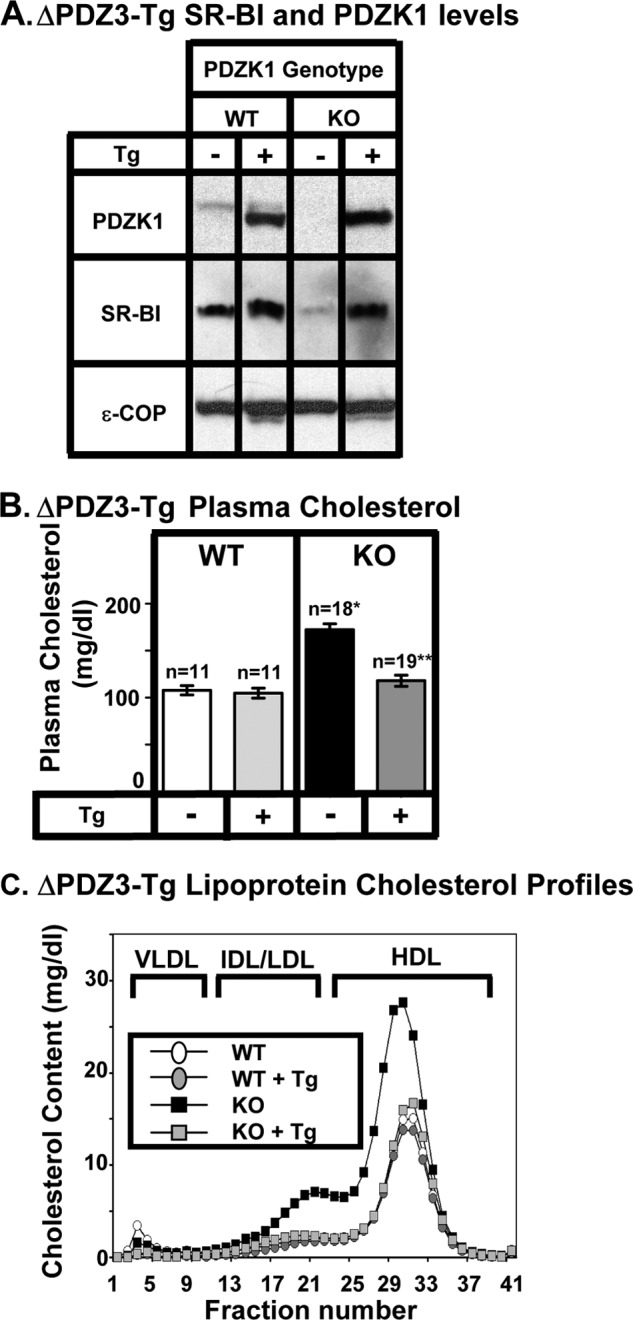
FIGURE 4.

Effects of expression of the ΔPDZ3 transgene on hepatic SR-BI protein levels (A) and plasma lipoprotein cholesterols (B and C) in WT and PDZK1 KO mice. A, liver lysates (∼30 μg of protein) from mice with the indicated genotypes, with (+) or without (-) the ΔPDZ3 Tg (deletion of the PDZ3 domain, see Fig. 1F), were analyzed by immunoblotting (data from founder 8642), and bands representing PDZK1 (∼70 kDa for WT) and SR-BI (∼82 kDa) were visualized by chemiluminescence. ϵ-COP (∼34 kDa) was used as a loading control. Note the faint SR-BI band in the nontransgenic PDZK1 KO lane. Replicate experiments with multiple exposures and sample loadings were used to determine the relative levels of expression of SR-BI (Table 2). B, plasma samples were harvested from mice with the indicated genotypes and ΔPDZ3 transgene. Total plasma cholesterol levels were determined in individual samples by enzymatic assay, and mean values from the indicated numbers of animals (n) are shown for each genotype. Independent WT and KO control animals for each founder line were generated to ensure that the mixed genetic backgrounds for experimental and control mice were matched. Values from the two independent founder lines, 8642 and 8640, were not statistically significantly different and thus were averaged together here. * indicates the nontransgenic KO plasma cholesterol levels were statistically significantly different from those plasma cholesterol levels of WT (p < 0.0001). ** indicates PDZK1 KO (ΔPDZ3-Tg) plasma cholesterol levels were statistically significantly different from those plasma cholesterol levels of nontransgenic PDZK1 KO mice (p < 0.0001). WT (ΔPDZ3-Tg) and KO (ΔPDZ3-Tg) plasma cholesterol levels were not statistically significantly different. C, pooled plasma samples (described in B) from four to five animals (data from founder 8642) were size-fractionated by FPLC, and the total cholesterol content of each fraction was determined by an enzymatic assay. The chromatograms are representative of multiple individually determined profiles. Approximate elution positions of native VLDL, IDL/LDL, and HDL particles are indicated by brackets and were determined as described previously (13). The chromatograms for the WT, WT+Tg, and KO+Tg are overlapping.
