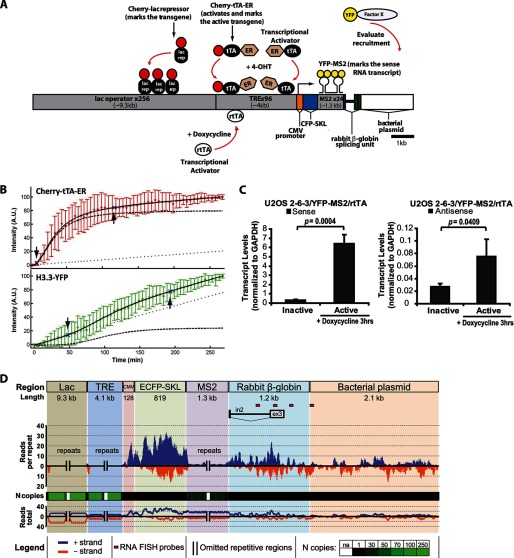
FIGURE 1.
Sense and antisense RNA is transcribed from the CMV promoter-regulated transgene in the ATRX-null U2OS cell line. A, diagram of the inducible transgene drawn to scale. Expression of the Cherry-lac repressor allows the transgene array to be visualized. Transcription is induced from the minimal CMV promoter by the activators Cherry-tTA-ER and ER-tTA in the presence of 4-hydroxytamoxifen (4-OHT) and rtTA in the presence of doxycycline (Dox). The transcribed RNA encodes CFP fused to a peroxisomal targeting signal (SKL). The RNA is visualized by YFP-MS2, which binds to the stem loops in the transcript. The 3′-end of the transcription unit is composed of the intron 2 splicing unit from the rabbit β-globin gene. The recruitment of YFP-tagged factors to the array can be monitored by co-expression with an array-binding protein. B, quantification of Cherry-tTA-ER (red) and H3.3-YFP (green) recruitment to the transgene array during activation in single cells. 4-Hydroxytamoxifen was added immediately after the first time point (∼0 min). Images were collected every 5 min for 4.5 h. Measured intensities were normalized to the high and low plateau values and fitted to a model (solid black line) containing logistic (dashed lines) and linear (dotted lines) parameters. The initial accumulation (downward pointing arrow) is the point when the logistic component of the curve deviates 5% from the initial base line. The end of rapid accumulation (upward pointing arrow) is the point when the logistic component reaches 95% of the final base line. The graph is the average of 13 independent cells. Error bars, S.D. Supplemental Movie 1 shows a representative time series. Table 1 summarizes the logistical and linear parameter values used in the equation to calculate intensity. C, strand-specific qRT-PCR analysis of total RNA collected from U2OS 2-6-3/YFP-MS2/rtTA cells 0 and 3 h after activation with doxycycline using a primer pair located in rabbit β-globin exon 3. Results are the average of at least three independent experiments. S.D. values, in the form of error bars, and p values, calculated using unpaired Student's t test, are presented in the graphs. D, strand-specific high throughput sequencing analysis of nuclear RNA isolated from 2-6-3/YFP-MS2/rtTA cells 3 h after activation with doxycycline. The upper bar depicts the structure of the transgene. Relative levels for sense (blue) and antisense (orange) transgene expression tags are shown below it. The black and green bar plot indicates the number of unique aligned sequencing reads across the transgene normalized by the number of repeated copies in the transgene segments. The heat map is color-coded for black to indicate the unique sequence regions; the green intensity is proportional to the repeat copy number in the transgene. The line plot at the bottom represents unnormalized data. Red rectangles below the transgene show the location of the strand-specific RNA FISH probes used in Fig. 2A.

