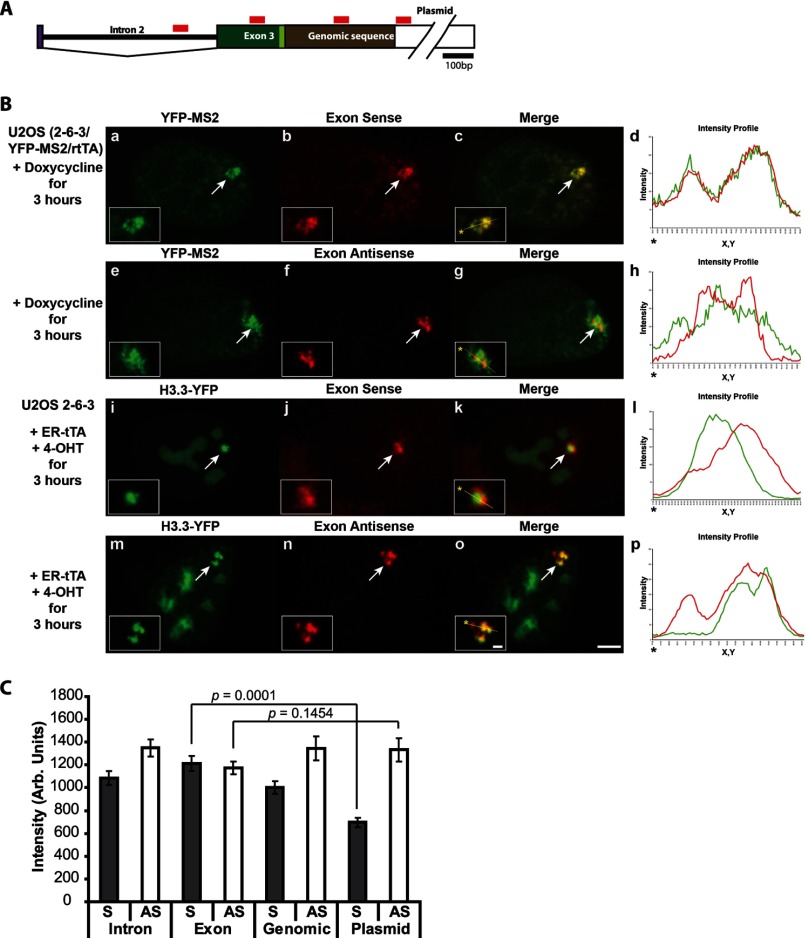
FIGURE 2.
H3.3 is recruited to sense and antisense RNA at the activated transgene array in U2OS cells. A, diagram of the 3′-end of the transcription unit (Fig. 1A) showing the locations of the strand-specific RNA FISH probes. B, localization of the exon sense (a–d) and exon antisense (e–h) RNA FISH probes at the activated array in relation to YFP-MS2. Shown is localization of the exon sense (i–l) and exon antisense (m–p) RNA FISH probes at activated arrays in relation to H3.3-YFP. Yellow lines in enlarged merge insets show the path through which the red and green intensities were measured in the intensity profiles (d, h, l, and p). Asterisks mark the start of the measured lines. Scale bar, 5 μm. Scale bar in enlarged inset, 1 μm. C, quantitative image analysis of S and AS RNA levels using the probes shown in A at arrays activated for 3 h. Error bars, S.E. p values, calculated using unpaired t test, are presented in the graphs. n values are as follows: intron, S, n = 19; AS, n = 26; exon, S, n = 21; AS, n = 27; genomic, S, n = 18; AS = 19; plasmid, S, n = 17; AS, n = 15.

