FIGURE 3.
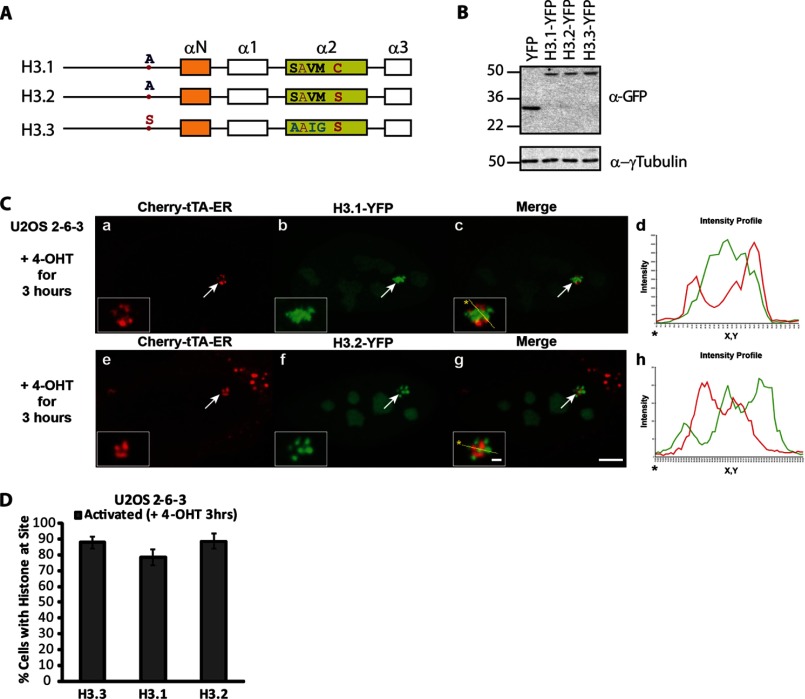
H3.1, H3.2, and H3.3 are all strongly recruited to the activated transgene array in U2OS cells. A, diagram of the domain structure of the H3 variants showing the locations of the amino acid differences between them. B, Western blot analysis of the YFP-tagged H3 variants using a GFP antibody. γ-Tubulin is used as a loading control. C, localization of H3.1-YFP (a–d) and H3.2-YFP (e–h) at the activated transgene array in relation to the activator, Cherry-tTA-ER. Yellow lines in the enlarged merge insets show the path through which the red and green intensities were measured in the intensity profiles (d and h). Asterisks mark the start of the measured line. Scale bar, 5 μm. Scale bars in enlarged inset, 1 μm. D, percentage of cells in which the histone H3 variants were recruited to the activated transgene array. 100 cells were counted in three independent experiments. S.D. values in the form of error bars are shown in the graph.

