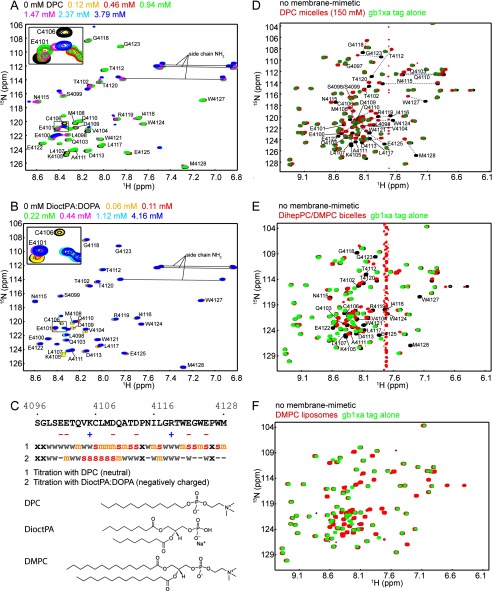
FIGURE 2.
Interaction of the human DNA-PKcs FATC domain with different membrane mimetics. A and B, 1H-15N HSQC spectra of hDNAPKfatc in the presence of increasing amounts of DPC or a 4:1 mixture of DioctPA/DOPA, respectively. The lipid concentrations with their respective color coding are indicated above each plot. The inserts in the upper left corners shows an enlarged view of the region highlighted by a black square. C, summary of the chemical shift differences observed in the NMR titrations shown in A and B. In all cases spectral changes were observed around the estimated CMC. Residues that disappeared just above the CMC are marked with a red letter s. Residues that disappeared or shifted significantly above the CMC are colored with an orange m, and those that disappeared or shifted at higher lipid concentrations are labeled with a gray w. Residues that were not significantly affected by the addition of lipid are marked with a minus sign, and an x represents an amino acid that shows no 1H-15N HSQC peak. In addition the chemical structures of DPC, DioctPA, and DMPC are shown. D–F, superposition of the 1H-15N HSQC spectra of hDNAPKfatc-gb1ent in the absence (black) or presence of a high concentration of DPC micelles, DihepPC/DMPC bicelles (∼270 mm total lipid concentration), or DMPC liposomes (<30 mm DMPC), respectively (red). To better discriminate the peaks corresponding to the FATC part, the spectrum of the GB1 tag (including a thrombin and a factor Xa site = GB1-xa) is shown in green at the top. Because the GB1 tag does not interact with membrane mimetics, its signals do not shift (39). The assignment is indicated by the single-letter amino acid code and the sequence position. See also supplemental Figs. S2–S6 for more information about the chemical shift assignments, a quantification of the observed shifts in E and F, and additional NMR-monitored lipid binding data.

