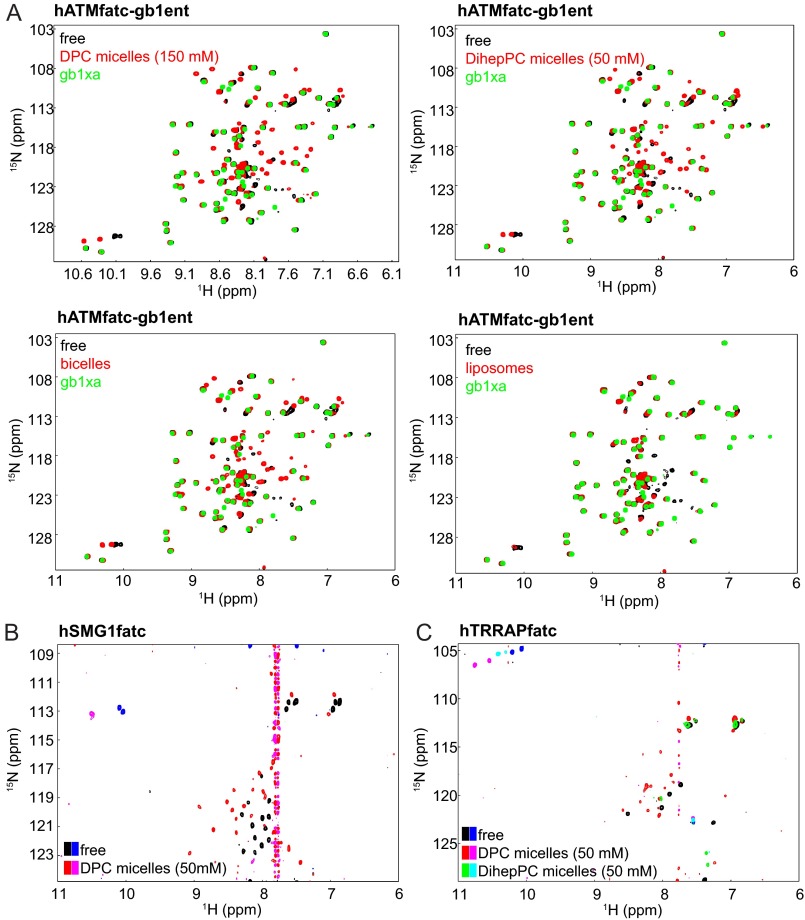
FIGURE 3.
NMR analysis of the interaction of the FATC domains of human ATM, SMG-1, and TRRAP with different membrane mimetics. A, superpositions of the 1H-15N HSQC spectra of hATMfatc-gb1ent in the absence and presence of either DPC or DihepPC micelles, DMPC/DihepPC bicelles, or DMPC liposomes. The spectrum of the free form is always shown in black and the one with the respective membrane mimetic in red. To better identify the signals of the ATM FATC part, the spectrum of the GB1 tag including an additional factor Xa site (= gb1xa) is additionally shown in green on top in each plot. Accordingly, all peaks that are green on top belong to the GB1 tag. As the GB1 tag does not interact with membrane mimetics, its signals do not shift (39). The superposition of the 1H-15N HSQC spectra corresponding to the titration of 15N hATMfatc-gb1ent with increasing amounts of DPC (0–50 mm) is displayed in supplemental Fig. S7A. B, superposition of the natural abundance 1H-15N SOFAST-HMQC spectra of hSMG1fatc in the absence and presence of DPC micelles. A superposition of the natural abundance 1H-15N HSQC spectra of the same protein in the absence and presence of DihepPC micelles is shown in supplemental Fig. S7B. C, superposition of the natural abundance 1H-15N HSQC spectra of hTRRAPfatc in the absence and presence of DPC micelles. Positive signals in B and C are shown in black, red, and green and negative ones in blue, magenta, and cyan. Because of the low solubility of hATRfatc, its interaction with membrane-mimetic DPC micelles could only be monitored based on one-dimensional NMR spectra (supplemental Fig. S8).

