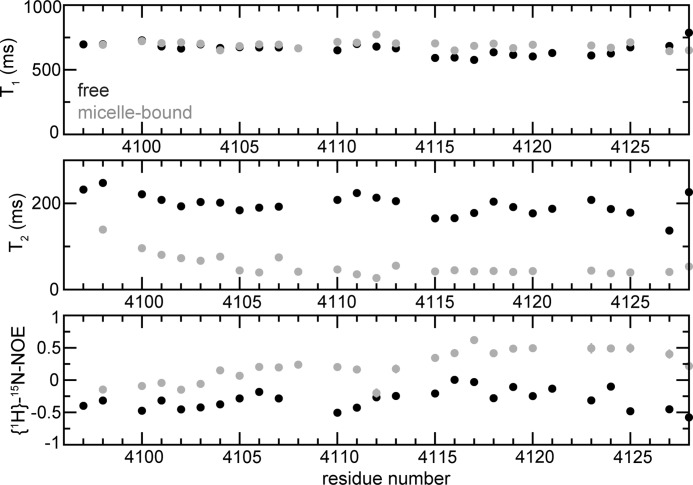
FIGURE 5.
Backbone dynamics of free and micelle-immersed FATC domain of DNA-PKcs. 15N T1 (first panel) and T2 (second panel) relaxation times and {1H}-15N NOE values (third panel) were plotted as a function of the sequence. The data for the free form are shown as filled black circles and that of the micelles-immersed form as filled gray circles. The data were measured using 15N hDNAPKfatc-gb1ent. The data for the whole fusion protein including the GB1 tag are displayed in supplemental Fig. S11. For comparison, see also the {1H}-15N NOE data for free and micelle-immersed hATMfatc-gb1ent shown in supplemental Fig. S13.

