FIGURE 5.
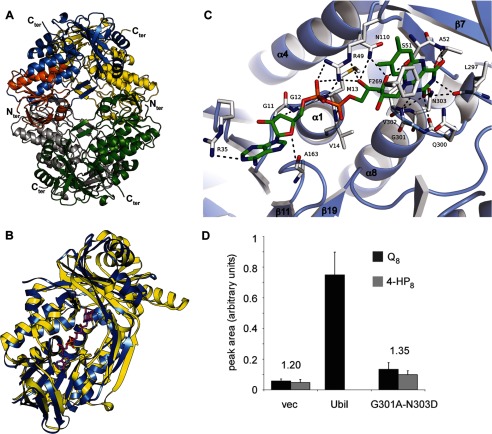
Crystal structure of a truncated form of UbiI and its FAD binding site. A, ribbon diagram of the crystal structure of tetrameric UbiItr. Each subunit is represented with a different color with the Rossman-like β/α/β-fold of one subunit highlighted in orange. B, DALI superimposition of UbiItr (blue) with PHBH (yellow; Protein Data Bank ID code 1PBE) and the FAD of PHBH shown as ball and sticks. The root mean square deviation is 3.0 Å for 327 Cα. C, Docking of FAD in UbiItr. Residues involved in hydrogen bonding and π-type interactions are represented. See details in supplemental Table S4. D, corrected integration of the electrochemical signal for the peaks corresponding to Q8 (in black) and 4-HP8 (in gray) after HPLC analysis of lipid extracts from ΔubiI cells containing an empty vector, pBAD-ubiI, or pBAD-ubiI(G301A/N303D) (n = 4). The ratio of the area of the Q8 and 4-HP8 peaks is indicated.

