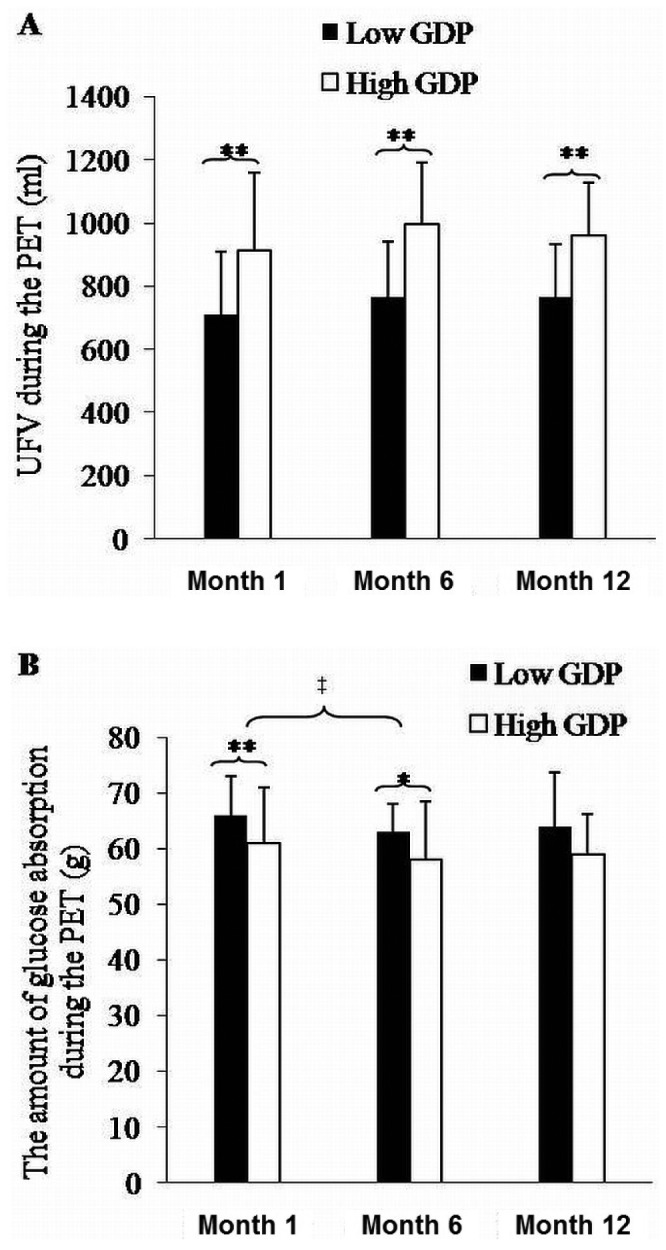
Figure 2.

— Data from the modified peritoneal equilibration test (PET) for the low-glucose degradation product [GDP (filled bars, n = 32)] and high-GDP groups (open bars, n = 28). (A) Ultrafiltration volume (UFV) during the modified PET. (B) Glucose absorption during the modified 4.25% PET. * p < 0.05 and ** p < 0.01 comparing the low-GDP group with the high-GDP group. ‡ p < 0.01 compared with month 1.
