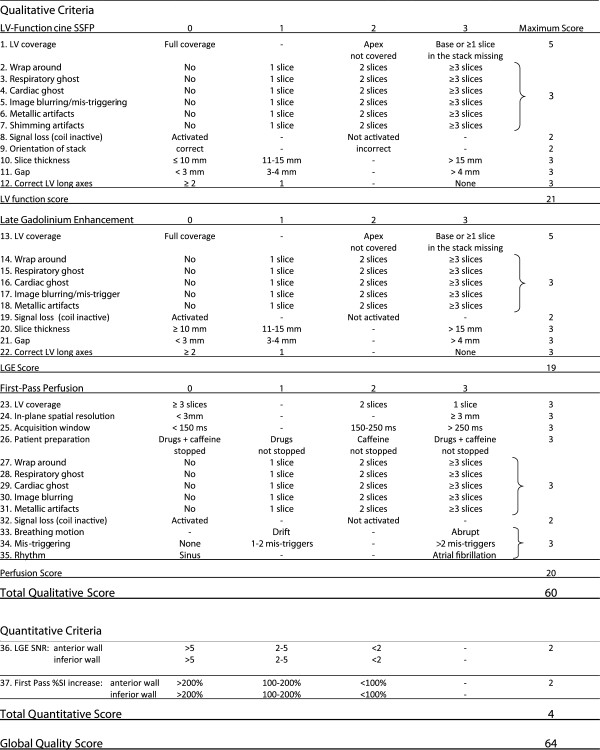
Figure 1.
Quality Evaluation of CMR Images.Total qualitative score: sum of qualitative scoring for SSFP images (12 criteria: range of scores 0–19, for LGE images (10 criteria: range of scores 0–19), and for perfusion images (13 criteria: range of scores 0–20). Total range: 0–60. Quantitative LGE score: 5 parameters measured yielding scores of 0–2 (SNR <2; 2–5; >5, respectively) for each the anterior and inferior LV wall. Total range of mean scores: 0–2. Quantitative perfusion score: 5 parameters measured yielding scores of 0–2 (%SI increase >200%; 100-200%; <100%, respectively) for each the anterior and inferior LV wall. Total range of mean scores: 0–2. Total quantitative score: sum of quantitative LGE and perfusion score. Range: 0–4. Global quality score: sum of total qualitative and total quantitative score: Range: 0–64.

