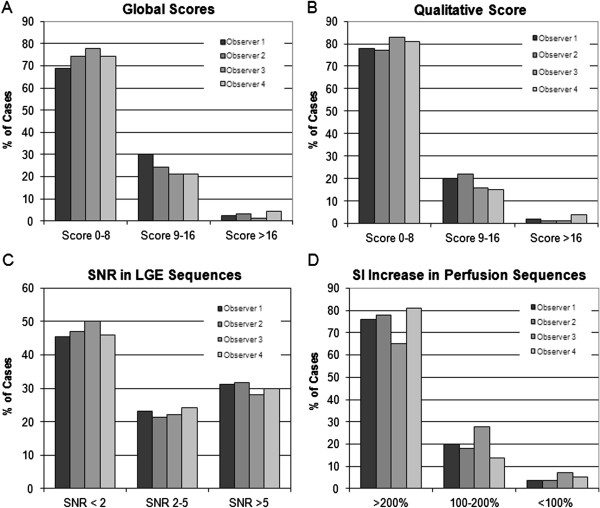
Figure 10.
Distribution of qualities in the entire study population (n=90) for the global quality score (A) as well as for the qualitative (B) and quantitative scores (C, D). The first tertile of quality scores (score <9) encompasses the largest portion of studies ranging between 69% - 78% of all cases (for readers 1–4). A similar distribution is observed for the qualitative and the quantitative perfusion score, whereas the LGE score shows a considerable portion of increased signal in the normal myocardium of 21-24% (SNR 2–5) and 28-32% (SNR >5) of all studies indicating a sub-optimal myocardial signal nulling in these cases.

