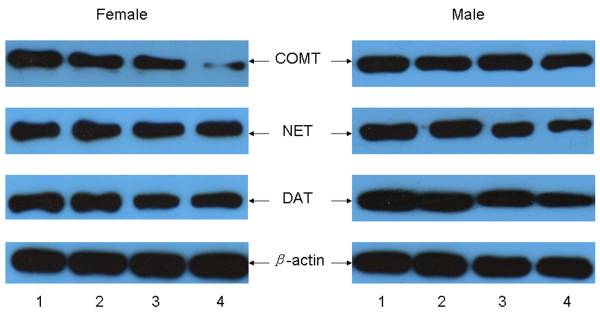
Figure 5.
Western blot analysis levels of DAT, NET, and COMT in the mPFC of both female and male offspring rats. Lane 1: left-side mPFC of control group females and males, respectively; Lane 2: right-side mPFC of control group females and males, respectively; Lane 3: left-side mPFC of CUS group females and males, respectively; Lane 4: right-side mPFC of CUS group females and males, respectively.

