
Figure 4.
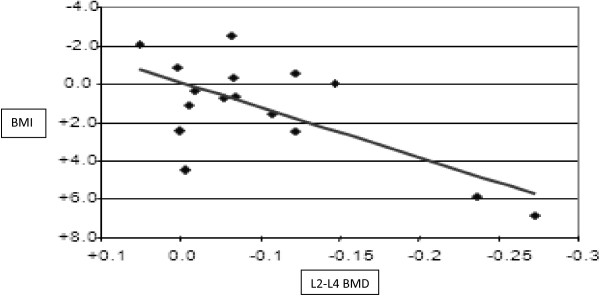
Simultaneous variation of BMI and BMD in the PI group, between the baseline and the end of the ninth month of treatment (M9). Changes in L2-L4 density were negatively correlated with variations of BMI (β = -0.682, 95%CI [-0.831;-0.879], p < 0.05).