
Figure 1.
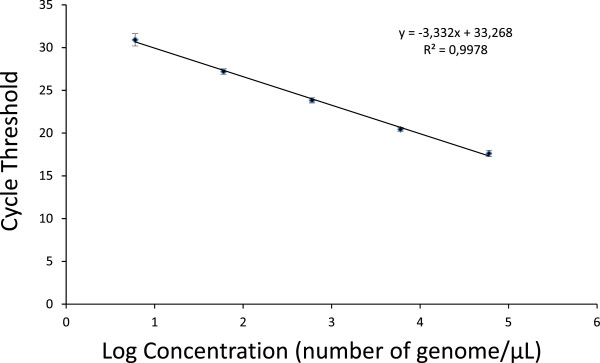
Standard curve of qPCR using serial dilutions of DNA from cultured parasites. Calibration curve was generated using 53 calibrations curves. The curve is based on the known DNA concentration (genomes/μL) and shows the reproducibility. Error bars show the standard deviation for each DNA standard from 6 to 60, 000 genomes/μL [11]. © Boissiere et al[11].