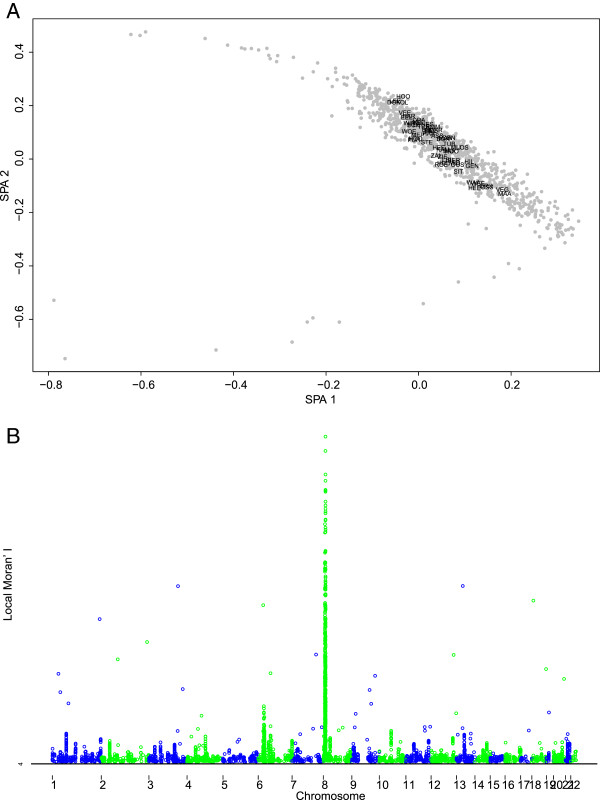
Figure 5.
Spatial analysis of the Dutch samples. A) Spatial ancestry analysis (SPA). Two Dimensional Mapping of 952 Dutch individuals (gray dots) using all the single nucleotide polymorphisms (SNPs); Dutch subpopulations are placed using the mean value of the individuals for each coordinate. For subpopulations see Table 1 and Figure 2. B) Manhattan plot of the Local Moran’s I value computed using the steep allele frequency gradient coefficient value estimated by SPA. Only SNPs showing a statistically significant value (P value <0.0005) of genomic spatial association are represented.

