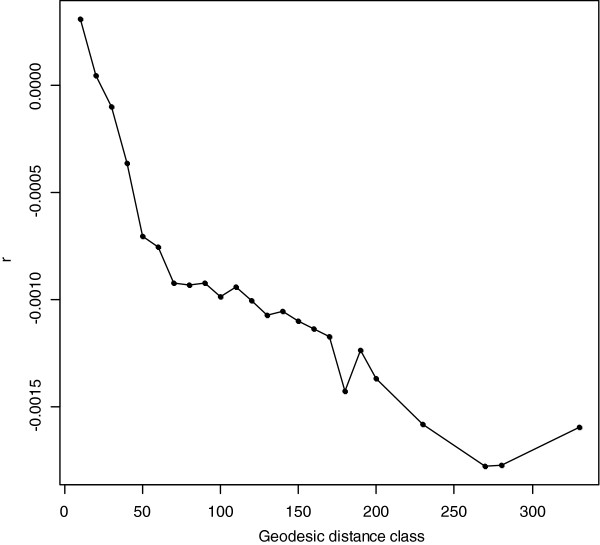
Figure 6.
Spatial autocorrelogram of the Dutch samples. Spatial autocorrelogram using the pairwise covariance matrix between the 969 Dutch individuals (after data cleaning). The matrix was estimated from a modified identical-by-state (IBS) distance matrix between pairs of individuals (see Methods for details) using the subset of linkage disequilibrium (LD) pruned genome-wide single nucleotide polymorphism (SNP) markers. Geodesic distance (in km) class between individuals is plotted on the X-axis. Level of autocorrelation for each distance class is depicted on the Y-axis.

