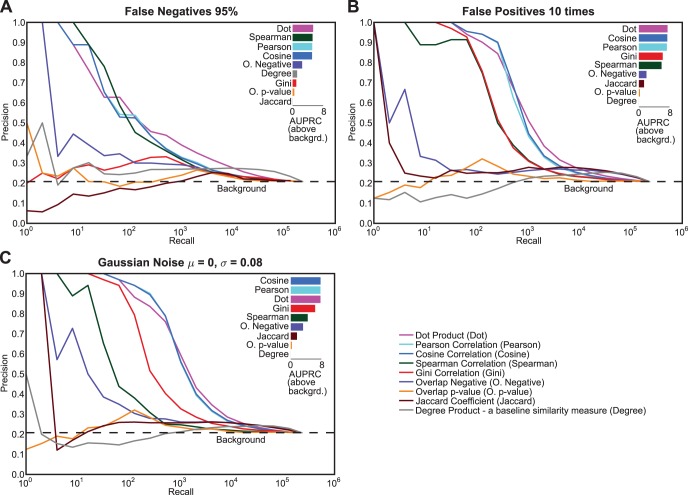
Figure 5. Role of noise in the genetic interaction data on similarity measure performance.
In each panel, simulated noise was added to the S. cerevisiae genetic interaction data, and query correlations were used for comparing the similarity measures. The simulated noise conditions are (A) false negatives –95% of the significant interactions whose absolute value of interaction is greater than 0.08 were randomly set to 0, (B) false positives – values were randomly sampled from the set of genetic interactions whose absolute interaction value were greater than 0.08 and were randomly substituted in place of randomly selected non-interactions. This random sampling was repeated until 10 times the number of significant interactions were added as false positives in the original data, and (C) Gaussian noise - random values from a Gaussian distribution of mean 0 and standard deviation 0.08 were added to all values (interactions and non-interactions) in the dataset. The bar plot on the upper right corner in each section shows the area under the precision-recall curve (AUPRC) above the background for each similarity measure. The area was calculated by summation of the areas of trapezoids at in increments of 2n (log2 units). The bars are sorted by their respective areas above background.

