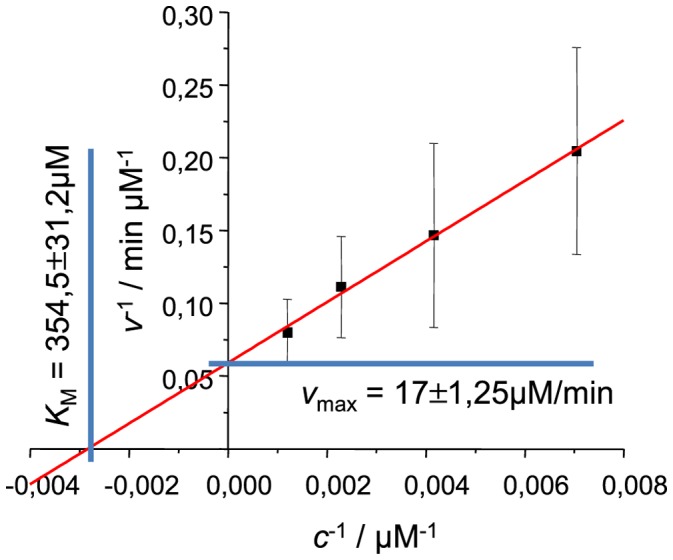
Figure 4. Lineweaver-Burk plot for fibril elongation.

Rates of elongation were measured at the point  , errors of elongation rates were estimated using the data from 5 different batches of seeds.

Rates of elongation were measured at the point  , errors of elongation rates were estimated using the data from 5 different batches of seeds.