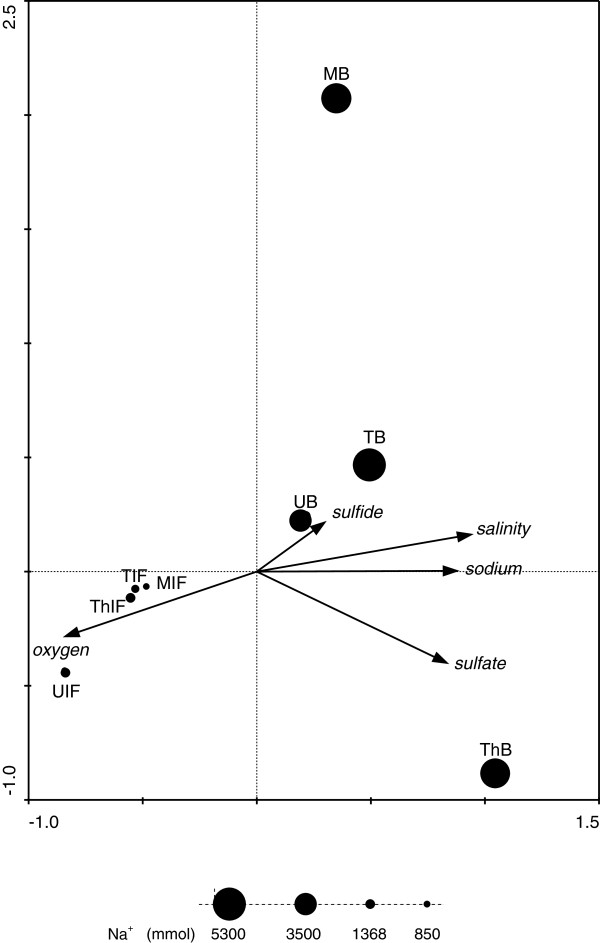
Figure 3.
Canonical correspondence analysis (CCA) of ciliate V4 SSU rRNA- amplicon profiles for brines (B) and halocline interfaces (IF) of the different sampling sites. This CCA depicts the best model in our CCAs, explaining 71.4% of the total variation within the community profiles with the first two axes accounting for 41% of community composition variance. The first two canonical axes (most important synthetic gradients) explained 51% of the variation of the species-environment relation. Sodium concentration is significantly (positively) correlated with the second axis (p = 0.003). Bubble sizes correspond to Na+ concentration in each sample. M = Medee, T = Tyro, Th = Thetis, U = Urania.

