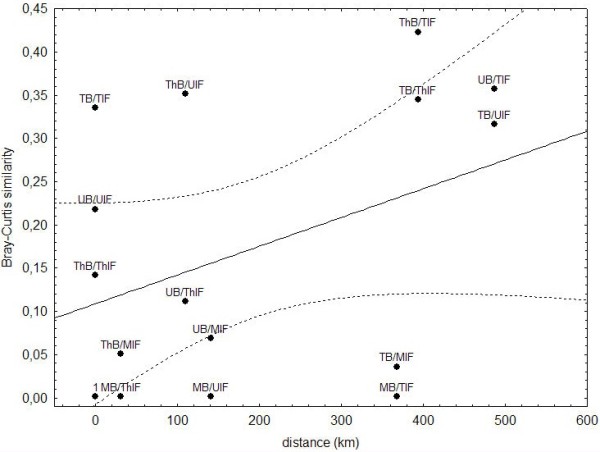
Figure 4.

Regression analyses of Bray-Curtis similarity between pairs of samples and the geographic distance between the respective sampling sites. Only little of the overall variability in protistan community similarities was accounted for by the regression model (R2 = 0.16). A Pearson-rank correlation between distance and community similarity is insignificant (p = 0.13). Dotted lines represent 95% confidence intervals of the regression model.
