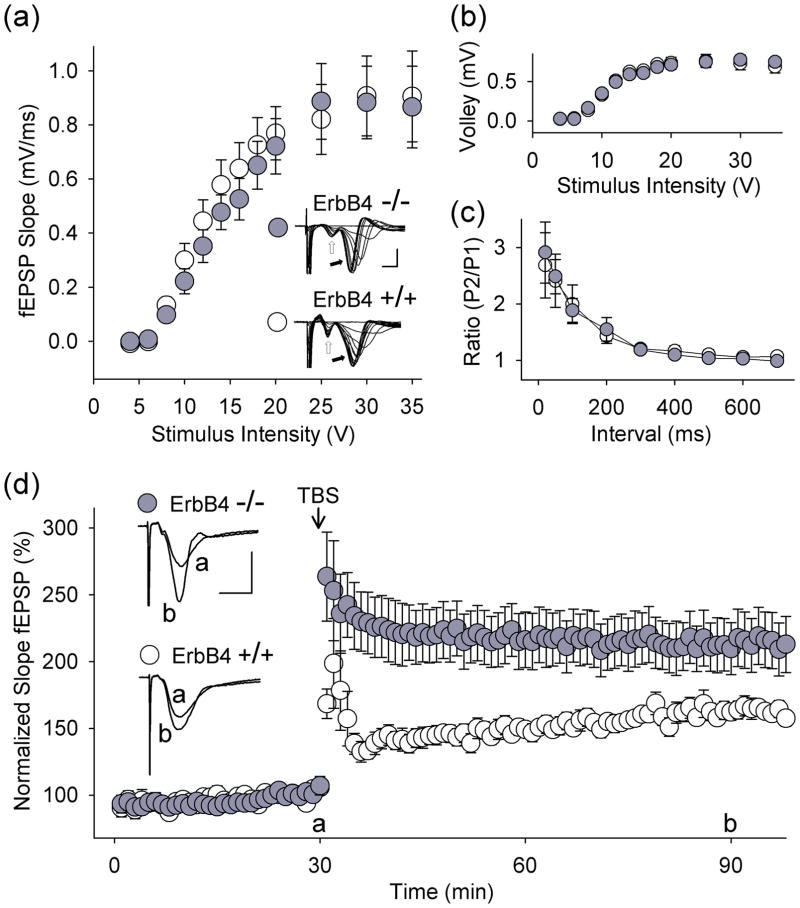
Fig. 2.
Loss of function of ErbB4 enhances tbLTP in CA1 hippocampus. (a) fEPSP slope and (b) fiber volley amplitude plotted as a function of stimulus intensity (ErbB4+/+HER4heart (ErbB4+/+), open circles; ErbB4−/−HER4heart (ErbB4−/−), filled circles). Strength of Schaffer collateral stimulation is indicated on the horizontal axis. Representative traces show fiber volley (open arrow) and fEPSPs (filled arrow; scale bars: 2 ms, 1 mV). In all panels, data are shown as mean ± SEM. (c) Paired-pulse facilitation of fEPSPs in slices from ErbB4+/+HER4heart (open circles) and ErbB4−/−HER4heart(filled circles) mice. Interstimulus interval is indicated on the horizontal axis. P1, first response; P2, second response. (d) Summary scatter plot shows grouped normalized fEPSP slope every 1 min in slices from ErbB4+/+HER4heart (open circles, n = 14 slices) and from ErbB4−/−HER4heart (filled circles, n = 14 slices) mice. Theta-burst stimulation was delivered to Schaffer collateral-CA1 synapses at the 30 min time point. fEPSP slope was normalized with respect to the mean slope of fEPSPs recorded during the 10 min period immediately before TBS. Inset: average of six consecutive fEPSPs recorded before or after TBS (‘a’ or ‘b’, respectively; scale bars: 10 ms, 0.5 mV). p < 0.01, ErbB4+/+HER4heart vs. ErbB4−/−HER4heart, 60 min after TBS.

