
Figure 6.
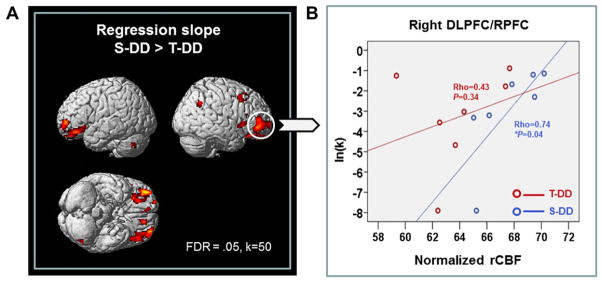
(A) Neurobehavioral correlation between ln(k) of DD tasks and rCBF: brain regions that showed steeper regression slope in S-DD than T-DD (B) Regression plots between normalized rCBF of the right rPFC and impulsive scale ln(k) during cTBS (red circle) and sham stimulation (blue circle) condition. *P < 0.05, Spearman’s correlation (two-tailed).