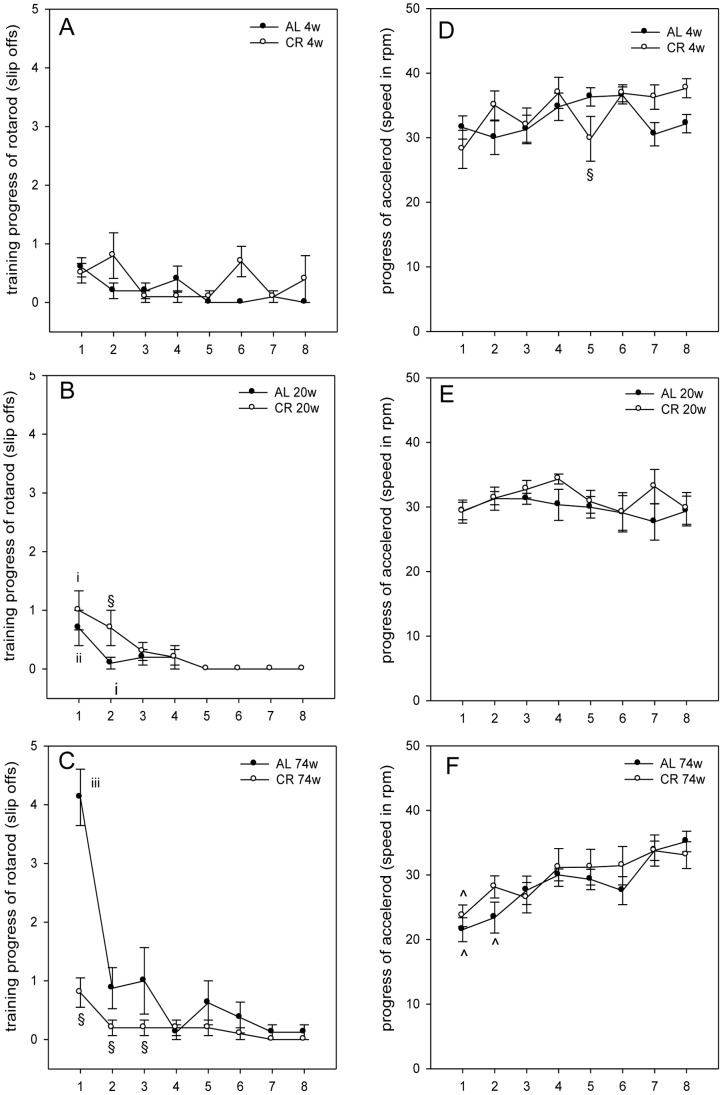
Figure 4. Motor coordination on the rotarod and accelerod test.
(A–C) The slip offs of the mice (AL: n4w, 20w, 74w = 10, 10, 8; CR: n4w, 20w, 74w = 10, 10, 10) from the rotarod were measured on 8 training trials (x-axis 1–8). (A) There were no significant differences in falling downs from the rotarod detected between 4 weeks (4w) ad libitum (AL) and caloric-restricted (CR) fed mice (group: F1,18 = 2.373, P = 0.141; trial: F1,7 = 1.961, P = 0.066; interaction: F1,7 = 1.919, P = 0.072). (B) Two-way repeated measures ANOVA (group vs. trial) of 20 weeks groups slip offs showed only a statistical significance for the main factor trial, but not for main factor group and for interaction (group: F1,18 = 1.301, P = 0.269; trial: F1,7 = 8.210, P<0.001; interaction: F1,7 = 1.102, P = 0.366). (C) There are significant differences between 74 weeks AL and CR fed mice for training trial 1–3, but 74 weeks AL fed mice showed a fast improvement of their rotarod performance. 74 weeks CR fed mice exhibited no significant differences between the slip offs of trial 1–8. Two-way repeated measures ANOVA (group vs. trial) of 74 weeks groups slip offs revealed for the main variables group and trial as well as for interaction between these factors statistically significant differences (group: F1,16 = 20.453, P<0.001; trial: F1,7 = 24.527, P<0.001; interaction: F1,7 = 11.732, P<0.001; Fig. 4C). Values are given as mean±SEM; ANOVA, post-hoc pairwise comparison tests: §P<0.05 vs. AL; iP<0.05 vs. trial 5–8; iiP<0.05 vs. trial 4–8; iiiP<0.05 vs. trial 2–8. (D–F) In the accelerod test the maximum speed (rpm) was measured in 8 test trials (x-axis 1–8) (AL: n4w, 20w, 74w = 10, 10, 8; CR: n4w, 20w, 74w = 10, 10, 10). Values are given as mean±SEM; ANOVA, post-hoc pairwise comparison tests: §P<0.05 vs. AL; ∧P<0.05 vs. trial 7–8.

