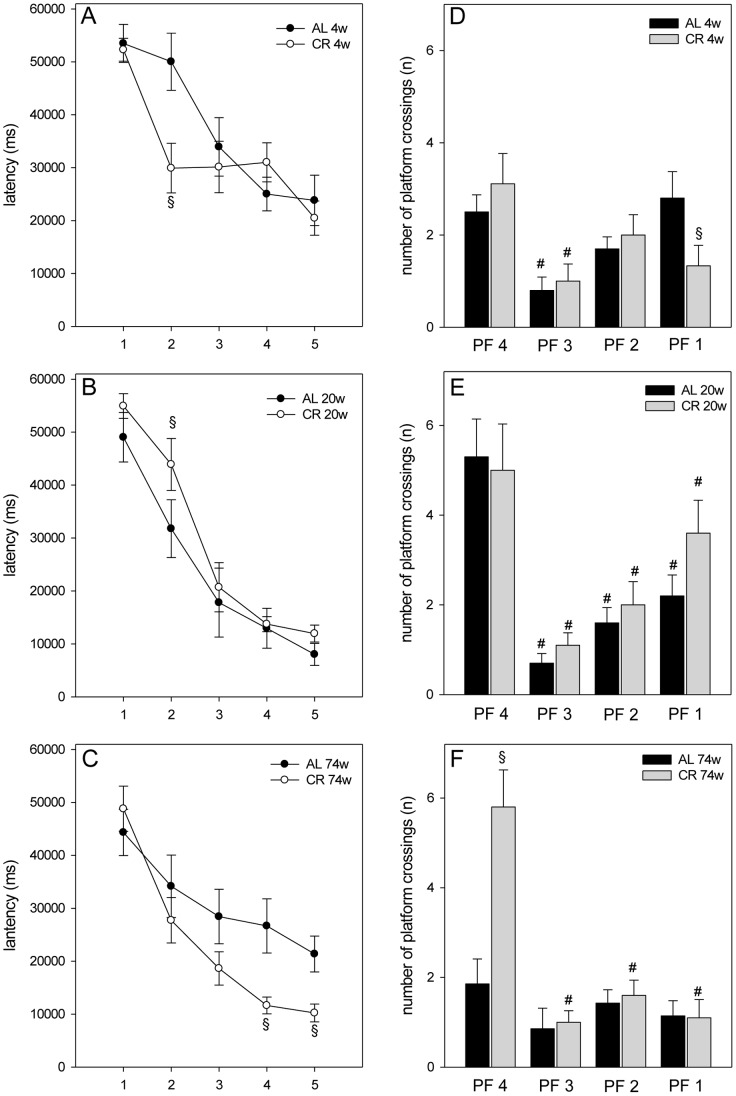
Figure 6. Spatial learning in morris water maze.
(A–C) The escape latencies (in ms) of the training were displayed in five blocks (x-axis 1–5). One block consisted of four consecutive trials. The escape latencies decreased throughout the training days. (A–B) For the 4 (4w) and 20 weeks (20w) AL and CR fed groups two-way ANOVA for repeated measures (group vs. block) revealed no significance for the main factor group (4 weeks: F1,17 = 0.934, P = 0.347; 20 weeks: F1,18 = 1.523, P = 0.233), but a significant effect for the main factor block (F1,4 = 29.753, P<0.001; F1,4 = 62.468, P<0.001). The interaction between these variables is significant between 4 weeks AL and CR fed mice (F1,4 = 4.807, P = 0.002), but no significance could be shown for interaction of 20 weeks fed groups (F1,4 = 0.918, P = 0.458). Two-way ANOVA for repeated measures (group vs. block) of the 74 weeks (74w) AL and CR fed mice indicated a significant effect for the main factors (group: F1,15 = 4.816, P = 0.044; block: F1,4 = 25.078, P<0.001), but there was no statistically significant interaction between group and block (F1,4 = 2.312, P = 0.068). Subsequent Holm-Sidak tests with an overall significance level of P = 0.05 showed only significant differences of escape latency in block 2 respectively between 4 and 20 weeks AL and CR fed mice (Fig. 6A–B). (C) Between 74 weeks AL and CR fed groups there were significant differences of escape latency in blocks 4 and 5. Values are given as mean±SEM; ANOVA, post-hoc pairwise comparison tests: §P<0.05 vs. AL. (D–F In this test trial, the number of platform crossings during 60 s was measured. (D and E) Two-way ANOVA of the 4 and 20 weeks fed groups (group vs. platform) showed no significances for the main factor group and for interaction between group and platform (4 weeks: group: F1,72 = 0.536, P = 0.466; interaction: F1,3 = 2.249, P = 0.090; 20 weeks: group: F1,72 = 1.188, P = 0.279; interaction: F1,3 = 0.644, P = 0.589). Values are given as mean±SEM; ANOVA, post-hoc pairwise comparison tests: #P<0.05 vs. PF4; §P<0.05 vs. AL. (F) The 74 weeks AL fed mice (n = 7) did not show significantly more crossings of PF4. Values are given as mean±SEM; ANOVA, post-hoc pairwise comparison tests: #P<0.05 vs. PF4; §P<0.05 vs. AL.

