
Figure 6. Breakdown of trunk to leg volume ratio by its major components.
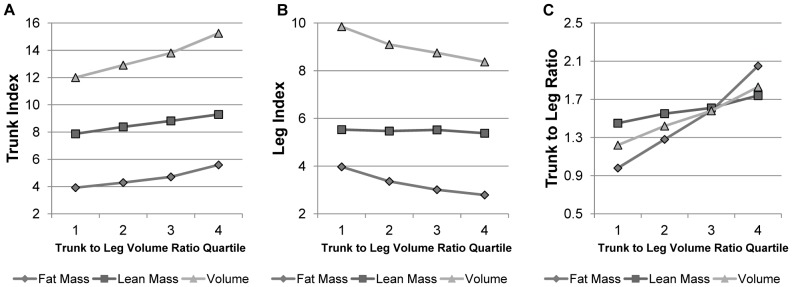
(A) Mean height-normalized trunk fat mass index (kg/m2), trunk lean mass index (kg/m2), and trunk volume index (L/m2) values are stratified by quartile of trunk to leg volume ratio. The increase in trunk volume is attributed mainly to the increase in trunk fat. (B) Mean height-normalized leg fat mass index (kg/m2), leg lean mass index (kg/m2), and leg volume index (L/m2) values are stratified by quartile of trunk to leg volume ratio. There is an overall decrease in leg volume primarily driven by a decrease in leg fat mass. (C) Mean trunk to leg fat mass ratio, trunk to leg lean mass ratio, and trunk to leg volume ratio are stratified by quartile of trunk to leg volume ratio. Trunk to leg fat mass ratio increases more dramatically than trunk to leg lean mass ratio.