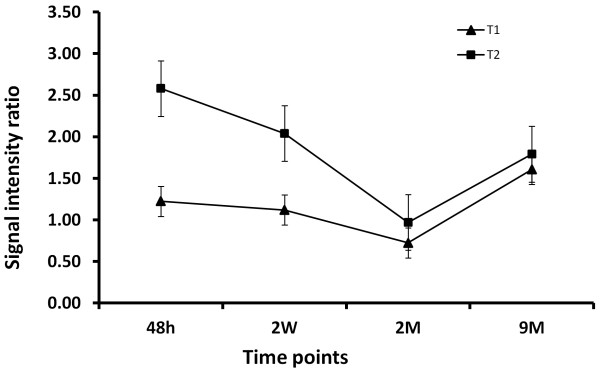
Figure 5.
The changes of signal intensity (SI) ratio with time on T1WI and T2WI of three LM cases. On T1WI, the SI ratio remained almost the same on 48 hours and 2 weeks after MI, decreased 2 months later indicating the formation of fibrotic scar; but elevated drastically after 9 months suggesting the substitution of fibrosis with the LM. On T2WI, the high SI ratio declined gradually from 48 hours to 2 weeks reflecting the serious to resolved edema, followed by a normalized ratio on 2 months due to fibrosis. The ratio after 9 months increased again due to the LM. The ratio changes on both T1WI and T2WI display a step-by-step evolution from myocardial necrosis through fibrosis to adipose substitution.

