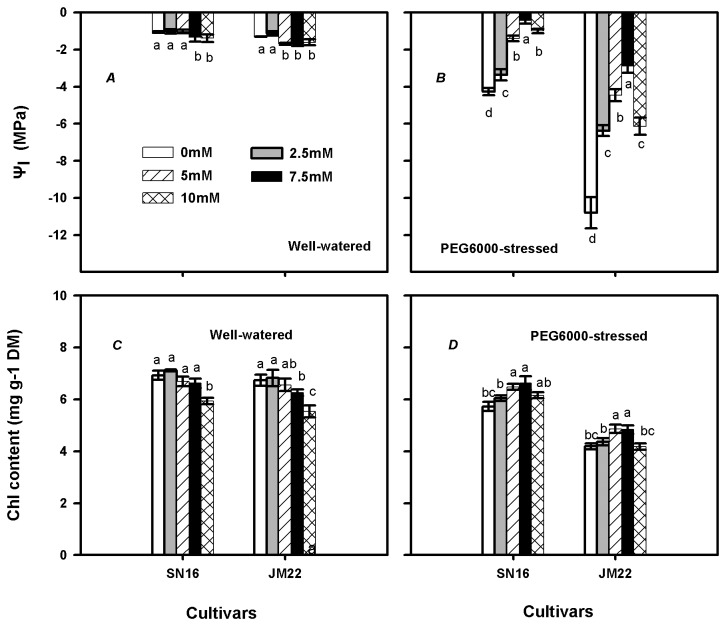
Figure 2. Effects of K2CO3 application on leaf water potential (Ψ l) and Chlorophyll (Chl) contents in SN16 and JM22 under different water treatments.
(A, C) Plants are in well-watered condition. (B, D) Plants are in 20% PEG6000-stressed condition. Vertical bars denote SE (n =6). Different letters indicate significant at p ≤0.05.

