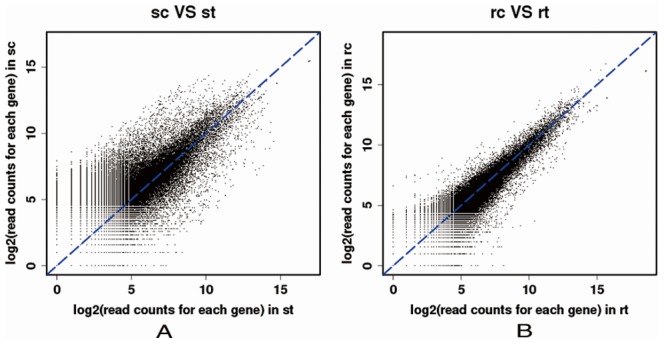
Figure 5. Scatter plot analysis of two sample pairs (sc VS st, rc VS rt) from barnyardgrass.

sc: untreated susceptible biotype; st: herbicide-treated susceptible biotype; rc: untreated resistant biotype; rt: herbicide-treated resistant biotype. Log2 transformed read counts of the mapped contigs and singletons were used for comparison.
