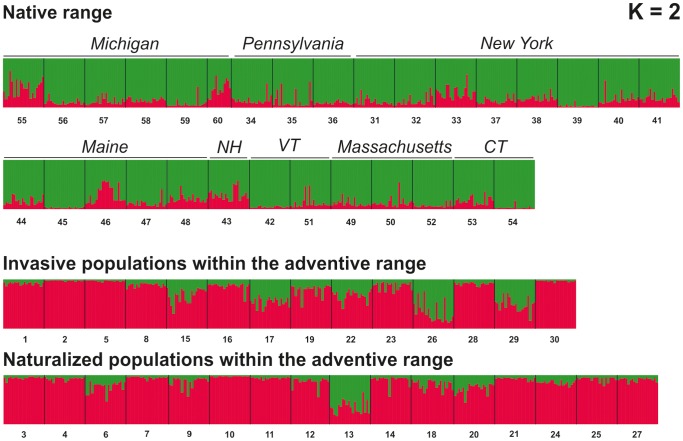
Figure 3. Results of assignment test.
Percentage assignment of each North American and European individual (represented by vertical bars) to each of the two clusters (represented by different colors) inferred by the program Structure. Site codes (see Table 1) indicate the geographical location of individuals along the x-axis.

