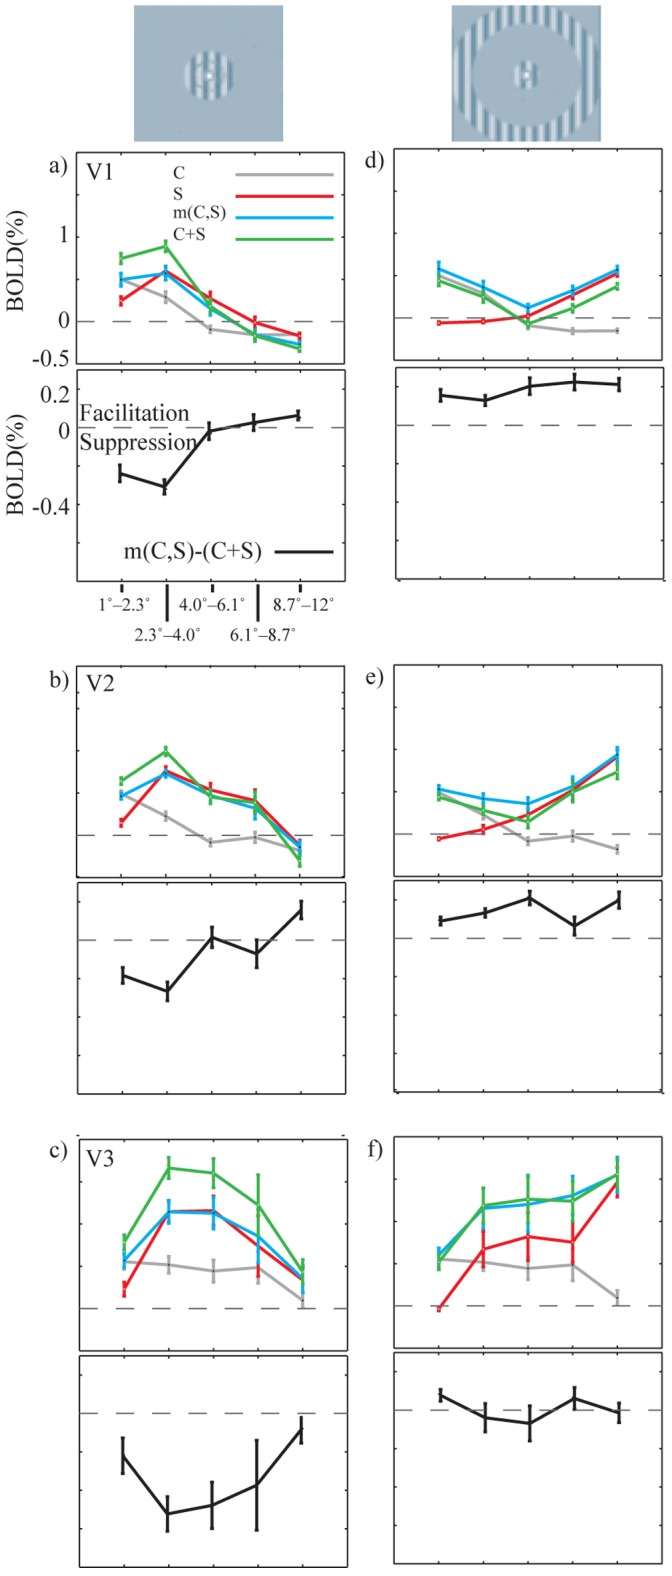
Figure 2. BOLD signal changes (%) for one subject (S3) as a function of eccentricity (VOI1°−2.3°–R8.7°−12°).

The C, S, m(C,S) and C+S signals, for V1, V2 and V3 areas, are plotted separately for near surround (a–c) and far surround (d–f) conditions. The lower panel of each graph shows the subtraction m(C,S) – (C+S) revealing suppressive interaction or facilitative interaction amplitude. Voxel selection was thresholded at PFWE = 0.05. Error bars display the standard errors of the means across active voxels. Note that the data for C is the same in the left and right columns.
