
Figure 3. The group mean BOLD signal changes (%) as a function of eccentricity.
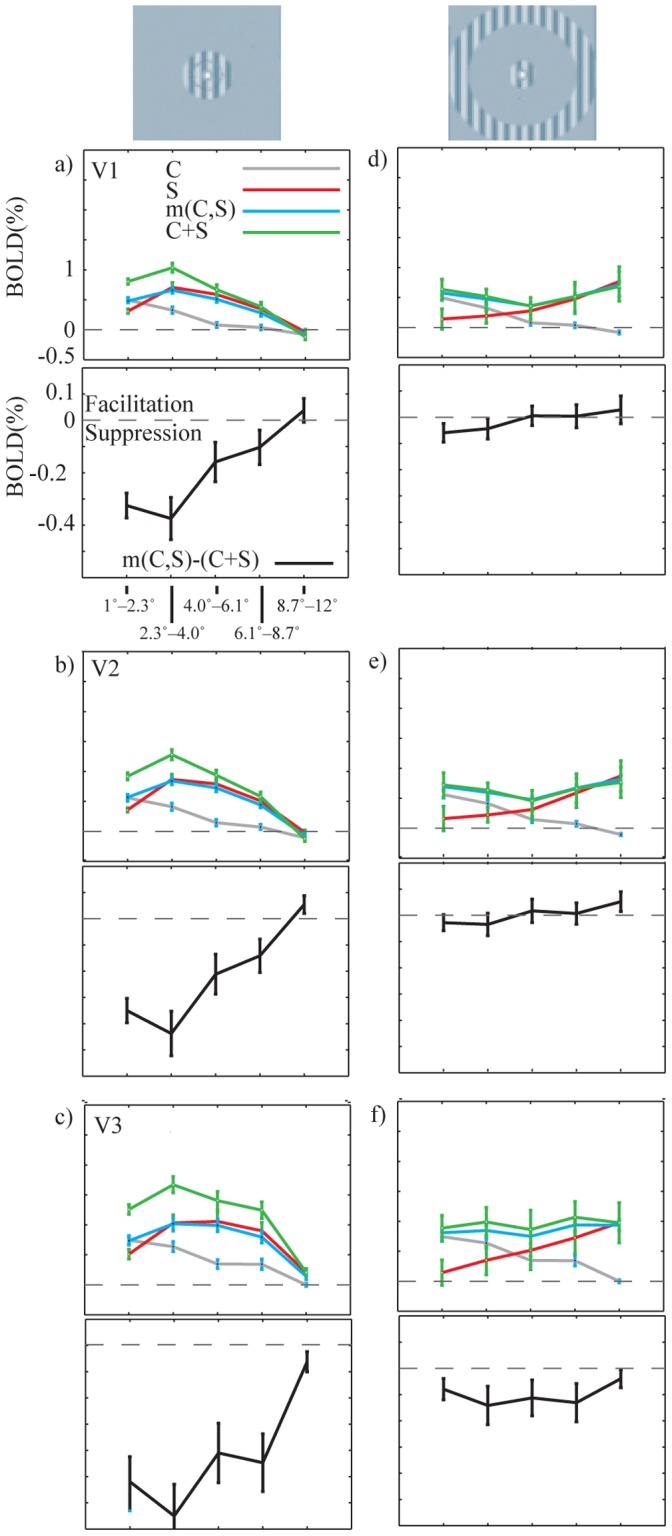
See Fig. 2. for further explanation.
Official websites use .gov
A
.gov website belongs to an official
government organization in the United States.
Secure .gov websites use HTTPS
A lock (
) or https:// means you've safely
connected to the .gov website. Share sensitive
information only on official, secure websites.
See Fig. 2. for further explanation.