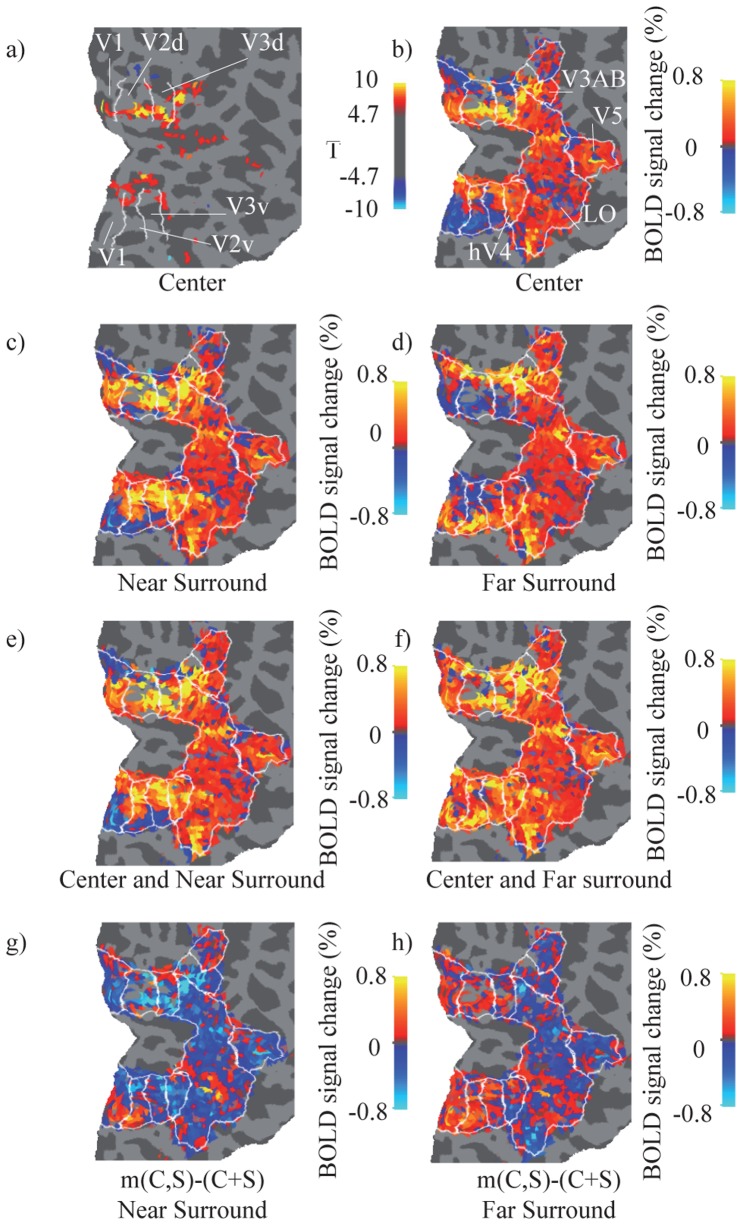
Figure 4. Relationship between BOLD signal overlap and interaction in Subject 3.
a) SPM T–values (thresholded at PFWE = 0.05, corresponding to T >4.7) for C contrast visualised on segmented and unfolded visual cortex. The white lines indicate the borders between visual areas. b) BOLD signal change (%) for C, limited to mapped functional visual areas. c) BOLD signal change (%) for SN. d) BOLD signal change (%) for SF. e) BOLD signal change (%) for C and SN together (m(C,SN)). f) BOLD signal change (%) for C and SF together (m(C,SF)). g) Difference of % signal change between m(C,SN) and sum of C and SN. A positive value (red-yellow) indicates facilitative interaction, and a negative value (blue) indicates suppressive interaction. h) Corresponding difference for m(C,SF) and C+SF.

