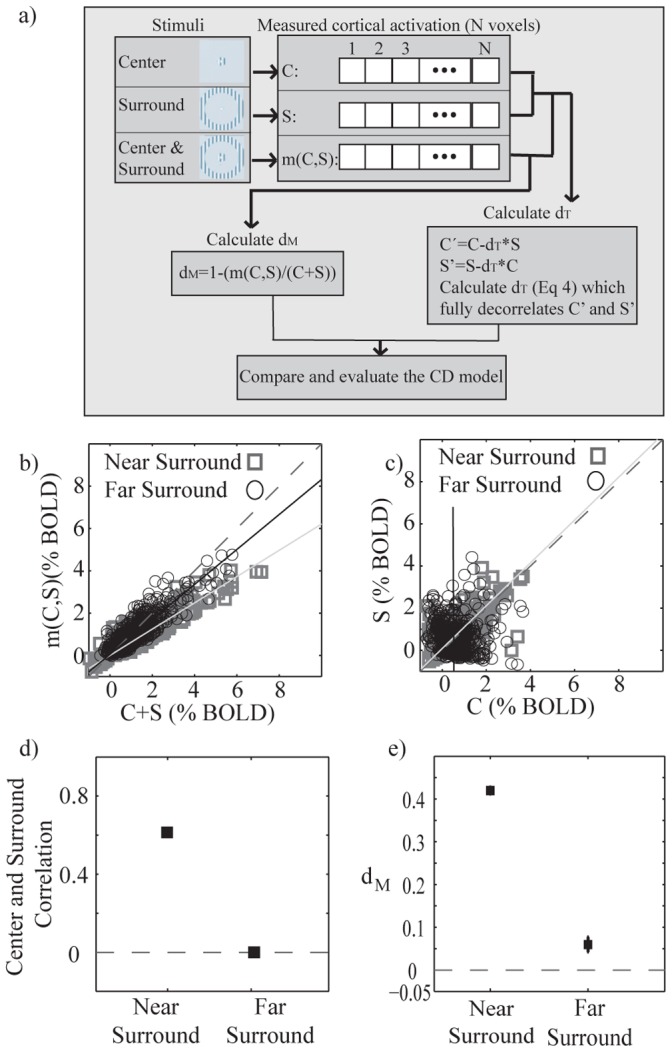
Figure 5. How to calculate theoretical and measured d and their relation with correlation of center and surround responses.

a) Schematic view for calculating the theoretical and measured d (dT and dM respectively). b) m(C,S) signal change plotted as a function of C+S for the voxels of interests for the C stimulus (VOIC, PFWE = 0.01). Black: C and SF. Gray: C and SN. The dashed line indicates the slope of one, and the solid lines linear regressors of the data. c) S signal change plotted as a function of C signal change for both near and far surround (VOIC, PFWE = 0.01). The dashed line indicates the slope of one, and the solid lines linear regressors of the data. d) Correlations between C and SN and C and SF signals. e) Mean (SE) measured d–coefficient (dM) for both near and far surround condition (PFWE = 0.01). BOLD % indicates BOLD signal change in %.
