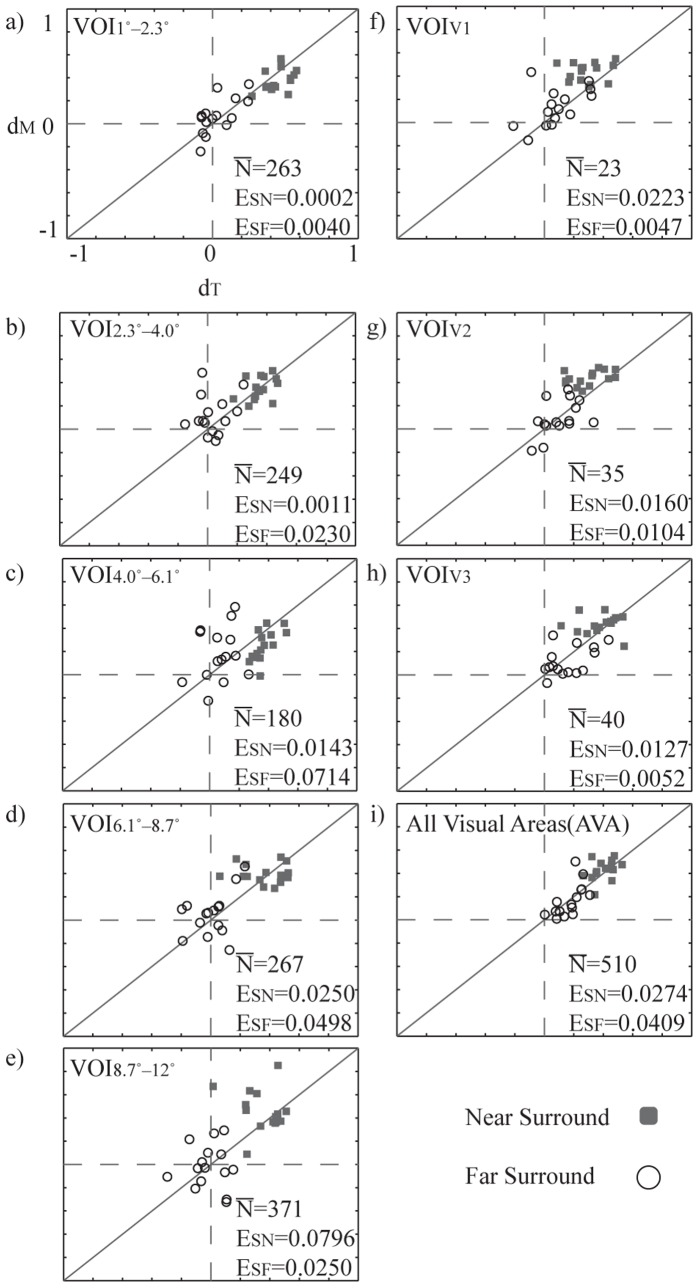
Figure 7. Optimally decorrelating dT values are plotted against median of measured dM values for all subjects, separately for near and far surround.
a) – e) Eccentricities; VOI1°−2.3°–VOI8.7°−12°. f) – h) Functional areas; VOIV1, VOIV2, and VOIV3. i) All cortical visual areas (PFWE = 0.01, VOIC). ESN is the average squared error between dM and dT in near surround for the 100 sets of resampled (N = 20) voxels. A fixed selection size renders the errors independent from the number of voxels in one area. ESF is the error for far surround. In each diagram,  is the average number of supra–threshold voxels across subjects.

