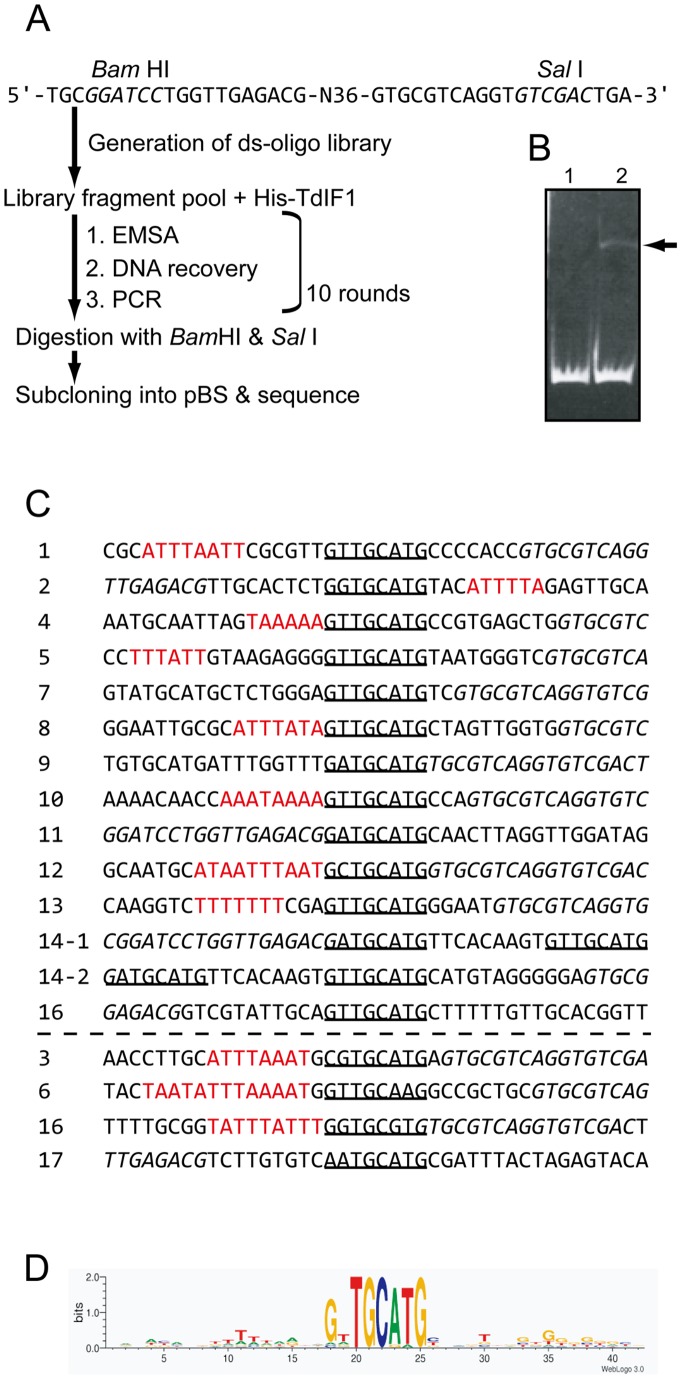
Figure 2. Identification of the DNA sequences recognized by TdIF1 by SELEX.
(A) Flow chart of the SELEX experiment. (B) EMSA results in the 7th cycle. DNA was detected by EtBr staining. The arrow indicates the TdIF1/oligoDNA complex. (C) Oligonucleotides selected by SELEX aligned around the identified consensus 5′-GNTGCATG-3′, underlined in each case. Sequences of six or more continuous As or Ts are in red. Flanking linker sequence shown in italics. (D) Conserved nucleotides drawn as a sequence logo [20].

