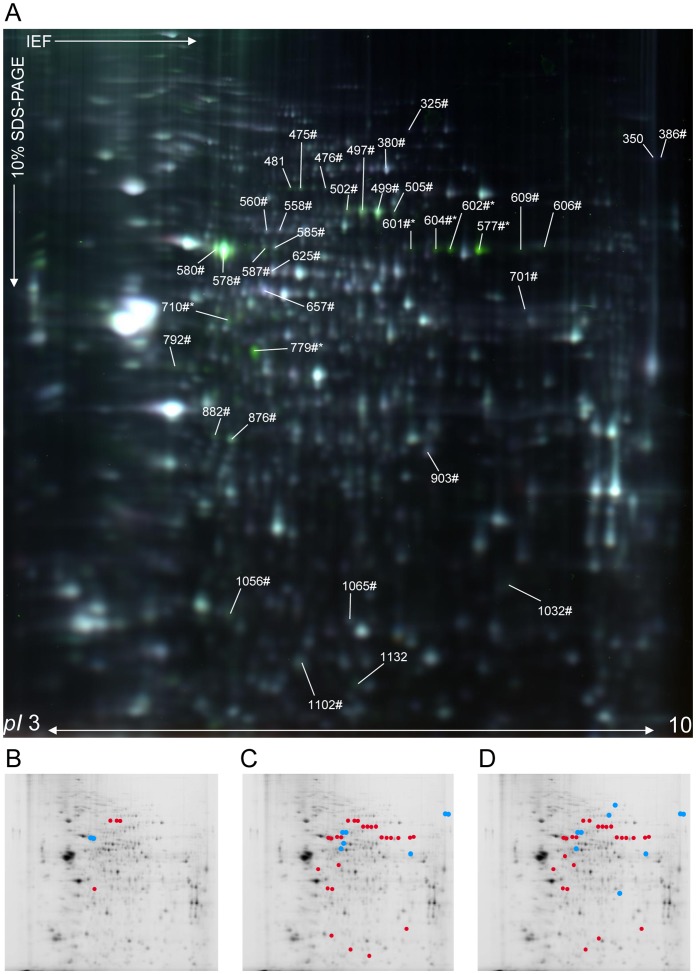
Figure 2. 2D-DIGE analysis (pH 3–10) of mock-, early and late WNV-infected brain samples.
(A) Representative data from a 2D-DIGE experiment using a 10% SDS-polyacrylamide gel with the pH range from 3 to 10 are shown. Proteins from mock- and late WNV-infected brain samples were labeled with Cy5 and Cy3 cyanine dyes, respectively. As determined by Progenesis SameSpot software, protein spots that were differentially regulated between the three experimental conditions (|ratio| ≥1.3 and p≤0.05), were submitted to mass spectrometry for identification. The numbers annotated on the gel correspond to master gel numbers of differentially regulated protein spots. Spots identified as Mus musculus (numbers#) and WNV (numbers*) proteins are listed in Table 1. Spots identified as a mixture of both species are indicated by numbers#*. Spots that were differentially modified between WNV-early and mock (B), WNV-late and WNV-early (C) and WNV-late and mock (D) infected samples are represented by red (up-regulated) or blue (down-regulated) dots.

