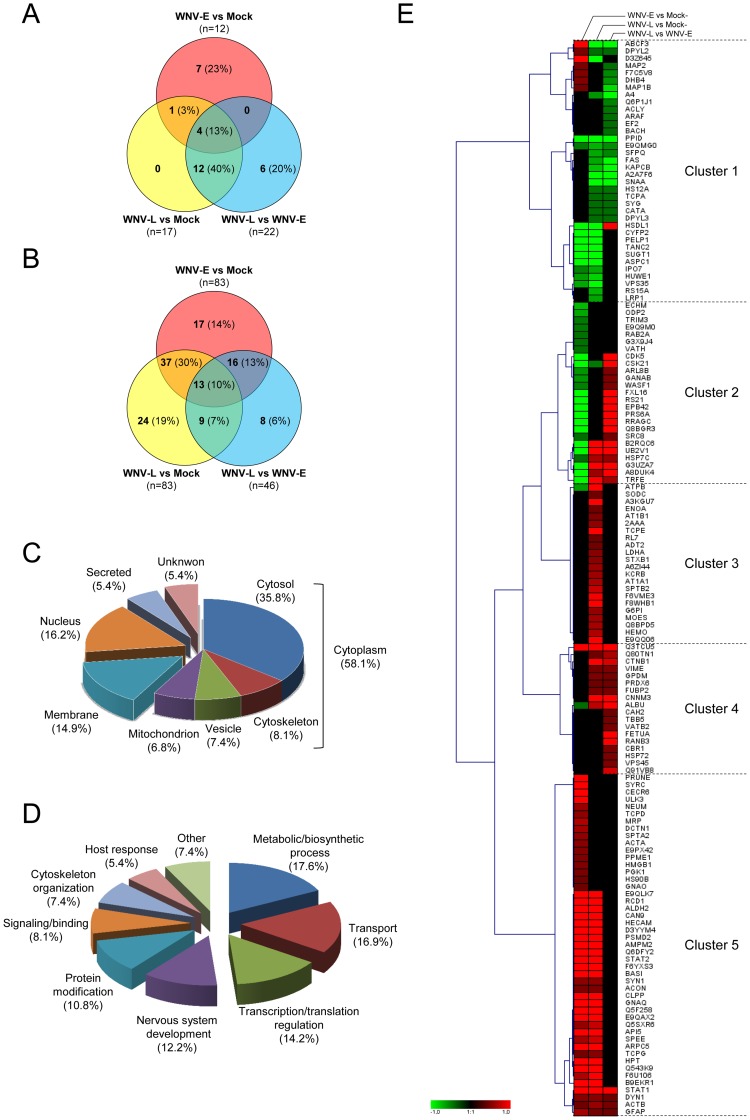
Figure 3. Classification of proteins significantly differentially regulated following WNV infection identified by 2D-DIGE and iTRAQ analysis.
Venn diagram representing unique host proteins identified according to experimental group comparisons following WNV-infection by 2D-DIGE (A) and iTRAQ (B) analysis. The number of host proteins significantly differentially regulated between WNV-E and mock, WNV-L and mock or WNV-L and WNV-E are indicated. The two samples that were compared are indicated adjacent to each circle. The number and the percentage of proteins associated with each category are indicated in brackets. Classification of the significantly differentially regulated proteins according to their sub-cellular location (C) and their functional categorization (D) according to gene ontology. The percentages of proteins associated with each category are indicated in brackets. (E) Hierarchical clustering analysis was performed according to the (mean) ratios calculated between WNV-E and mock, WNV-L and mock or WNV-L and WNV-E, as indicated at the top of the graphic. Up- and down-regulated proteins are shown in red and green, respectively, and proteins with no change in expression level are indicated in black. The intensity of red or green color corresponds to the degree of regulation as indicated by the color strip at the bottom of the figure in arbitrary units. The graphical cluster was generated using the Genesis program [130].

