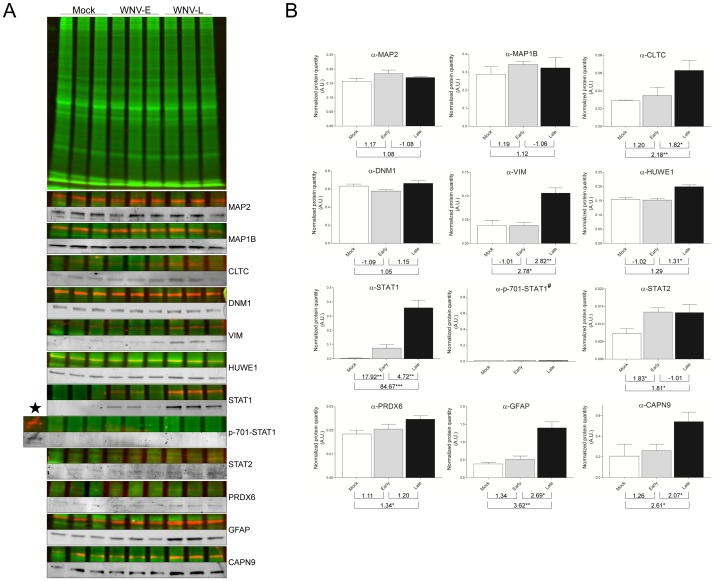
Figure 4. Western blot validations of differentially regulated proteins identified by 2D-DIGE and/or iTRAQ analyses.
(A) Protein samples from each group used for proteomic analysis were minimally labeled with cyanine-3 dye. At the top, a representative protein profile of three biological replicates from brain lysates of mock-, and WNV early- and late-infected mice, separated by 10% SDS-PAGE is shown. WB with fluorescence-based methods was used to detect an overlaid fluorescent scan of the general protein patterns (Cy3 dye (green)) and the specific immunoreactive proteins (FITC or Cy5 dye (red)). To better visualize protein detection signals observed with each specific antibody used, corresponding cropped WB images are presented in grey levels. (B) The graphs correspond to the mean ± S.D. of protein quantity measured by densitometry of the antigenic bands. Densitometry analyses were performed using TotalLab Quant v12.2 software (Nonlinear Dynamics), and data were normalized to levels of global protein pattern intensity. The values indicated under each graph correspond to fold changes from paired comparisons (i.e., WNV-E/mock, WNV-L/mock, WNV-L/WNV-E). WNV-E/−L, biological replicates of brain samples infected by West Nile Virus and collected at early or late time-points. The significance of the differential protein expression are indicated *, p<0.05; **, p<0.01; ***, p<0.001. A.U., arbitrary units. α-, antibody anti-; ★, IFN-γ activated mice bone marrow derived macrophage (p-701-STAT1 positive control); #, no quantification for p-701-STAT1. CAPN9, calpain 9; CLTC, clathrin heavy chain; DNM1, dynamin 1; GFAP, glial fibrillary acidic protein; HUWE1; E3 ubiquitin-protein ligase; MAP1B, microtubule-associated protein 1B; MAP2, microtubule-associated protein 2; PRDX6, peroxiredoxin 6; STAT1/2, signal transducer and activator of transcription 1/2; VIM, vimentin.

