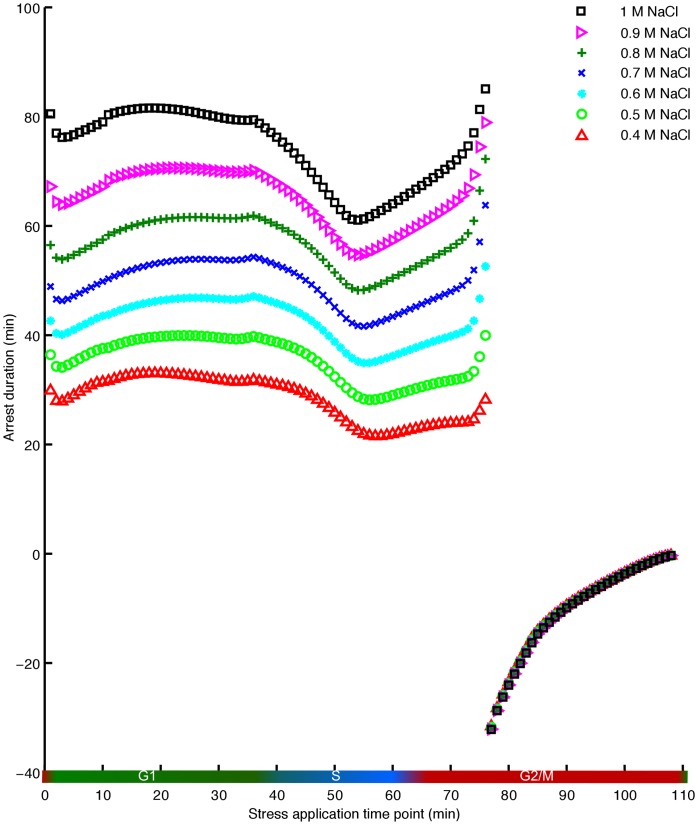
Figure 2. Dose-dependent arrest duration following the imposition of osmotic stress at different stages of the cell cycle.
The x-axis represents the time point of application of stress, whereas the y-axis illustrates the corresponding arrest duration. Different colours demonstrate various doses of the stress, ranging from 0.4 M NaCl to 1 M NaCl. During the G1 phase and the S phase, higher doses of stress cause longer cell cycle arrests, while the acceleration of the exit from mitosis is dose independent.

