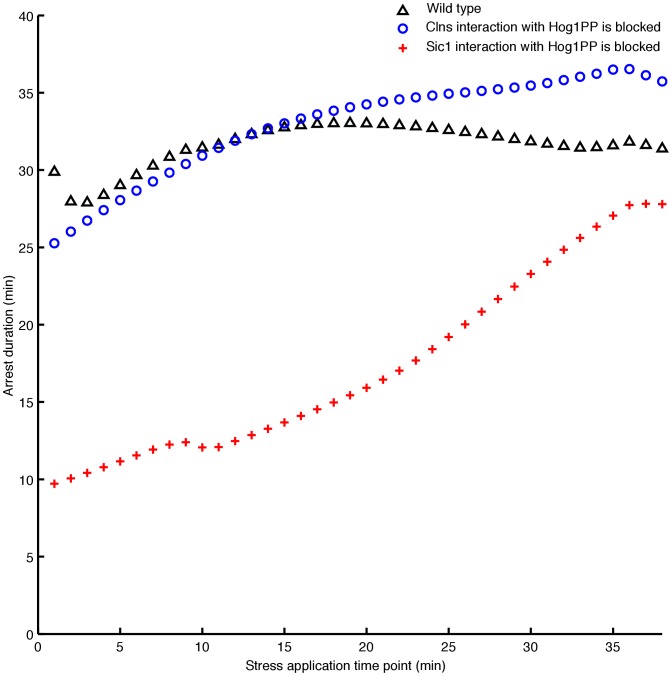
Figure 4. Assessing the role of two key mechanisms responsible for the cell adaptation to osmotic stress during the G1 phase.
The x-axis represents the time point of application of stress, whereas the y-axis illustrates the corresponding arrest duration. Blocking the interaction of Sic1 with Hog1PP, reduces the arrest duration significantly along the G1 phase (red crosses).

