Fig. 1.
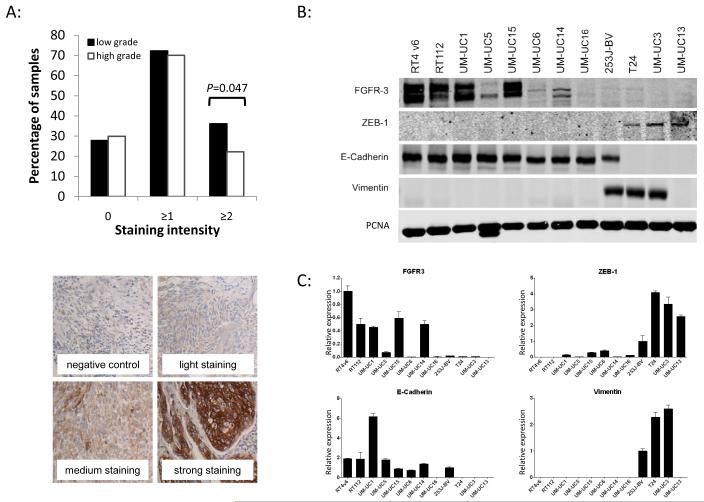
A: Tissue microarray analysis for total FGFR3 expression. A TMA was stained for FGFR3 expression with a human specific FGFR3 antibody. Staining was semi-quantitative analyzed and staining intensity assessed between 0 (no staining) and 3 (intensive staining). Average staining intensity was analyzed for tumor grade. One sided chi-square test was performed and revealed a significant overexpression (P=0.047) of FGFR3 in low grade tumors compared to high grade tumors with a positive staining in 36% and 22% percent of tumors, respectively. The percentages of patients with the specified staining intensities add up to >100% because the ≥1 and ≥2 intensity groups overlap. B: Western blot analysis of FGFR3 in relation to epithelial and mesenchymal markers in a panel of urothelial cancer cell lines. C: qPCR analysis for FGFR3 in relation to epithelial and mesenchymal markers in a panel of urothelial cancer cell lines. Expression of total FGFR3 is associated with an epithelial phenotype of cell lines. Epithelial cell lines defined by expression of E-Cadherin show higher levels of FGFR3 than mesenchymal cell lines characterized by loss of E-Cadherin and expression of ZEB-1 and Vimentin.

