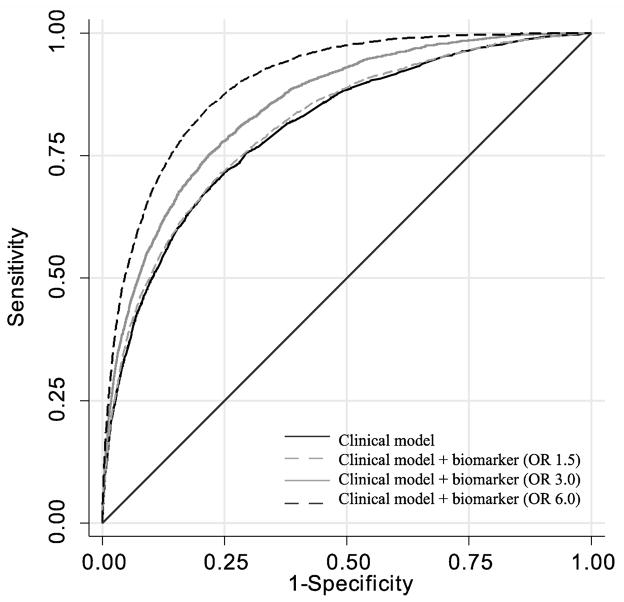
Figure 1.
Receiver operating characteristic curve for clinical model compared to models that include biomarkers of increasing strength. Clinical model with a weak biomarker (OR 1.5) as shown as dashed grey line (OR=1.5), a moderate biomarker (OR=3.0) shown as grey line, and a strong biomarker (OR=6.0) shown as dashed black line.

