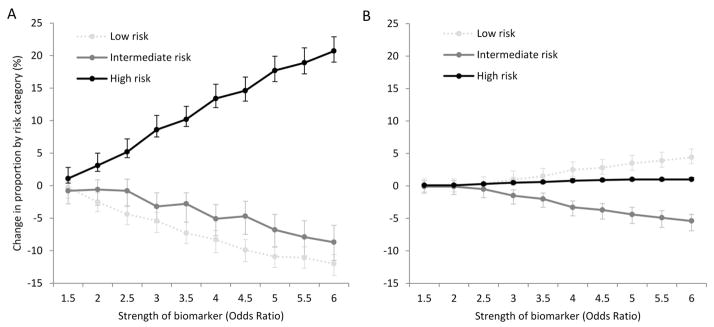
Figure 2.

Proportional change in each risk category (low, intermediate, high) for critical illness when adding biomarkers of increasing strength to the clinical triage model. Cases (panel A) and controls (panel B) shown separately.
Interpretive example: When a moderate strength biomarker (OR=3.0) is added to a clinical risk model, the proportion of all cases classified as high risk increases by 9% (panel A), the proportion classified as intermediate risk decreases by 3%, and low risk decreases by 5%. In contrast, the proportion of controls classified as low risk increases by 1% (panel B) with no change in the proportion classified as high risk.
