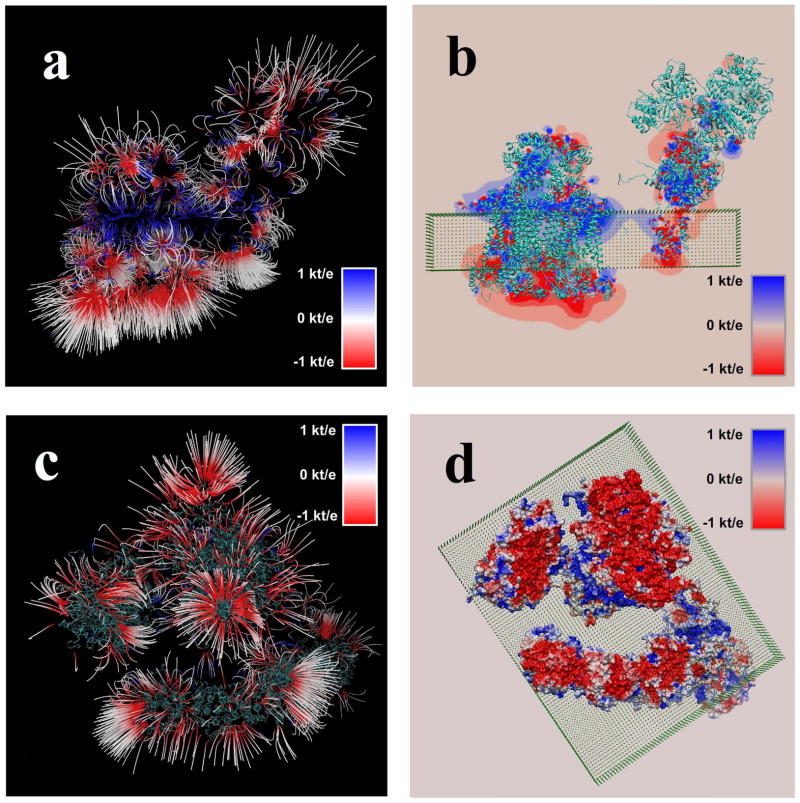
Figure 5.
Resulting electrostatic field and potential maps of the bovine mitochondrial supercomplex. Membrane is shown as a slab made of pseudo atoms. (a) Electrostatic field distribution in case of side-view; (b) Potential distribution in a plane at the center of the supercomplex, side-view. The protein moiety is shown as well; (c) Electrostatic field distribution in case of membrane-view; and (d) Electrostatic potential mapped onto molecular surface of the supercomplex, membrane-view. The protein moiety is shown as well.

